System
The organization had an OEE framework for machine-level performance, but the cutting department had no process traceability. Operational data was recorded by hand and scattered across multiple process points. Fabric consumption could not be checked against marker requirements. End-bit generation had no accountability structure. WIP movement between stages was invisible in real time. Operator productivity was estimated manually and assessed subjectively.
The project mandate was to implement a fully digital traceability system across all cutting operations, establishing end-to-end visibility for every fabric roll throughout the cutting lifecycle and capturing process-level production data in real time.
| Operational Area | Before | After |
|---|---|---|
| Fabric Traceability | Zero, no roll-level visibility at any stage of the cutting process | Full end-to-end, every roll tracked from store entry through relaxation, spreading, cutting, bundling, and QC |
| Consumption Visibility | Not visible, actual fabric usage against CAD marker requirements could not be measured | Visible, style-wise actual vs theoretical consumption tracked at roll level per lay |
| End-bit Accountability | Untracked, residual fabric lengths disposed of or reused without records | Tracked, every residual length digitally allocated, recovery purpose recorded, utilization history maintained |
| WIP Visibility | Not available in real time, bundle status known only at end-of-shift reconciliation | Live, bundle status, stage location, and throughput visible across all 11 floors in real time |
| Operator Performance | Subjective, productivity assessed by supervisor estimation without objective measurement | Objective, individual input minutes, process output, and efficiency percentage captured per activity |
| Production Reporting | Manual, significant consolidation effort per floor before management visibility was available | Automated, all 7 report types generated directly from scan data with zero manual consolidation |
| Challenge Area | Operational Impact | Root Cause |
|---|---|---|
| Fabric Consumption | Could not validate actual usage against CAD marker requirements | No roll-level data capture at spreading stage |
| End-bit Management | Hidden wastage and fabric leakage from untracked residual lengths | No accountability system for end-bit generation or reuse |
| WIP Visibility | No real-time view of material movement between cutting stages | Manual recording only, delayed and incomplete |
| Operator Productivity | Subjective, unreliable efficiency measurement | No individual-level digital activity capture |
| Daily Reporting | Extensive manual consolidation required before management visibility | No automated data aggregation capability |
| Consumption Variance | Could not isolate variance to specific process points or styles | No style-wise or stage-wise consumption tracking |
| Planning Coordination | Store and planning teams lacked live production visibility | No integration between floor operations and planning systems |
- Establish end-to-end visibility for every fabric roll throughout the cutting lifecycle
- Capture process-level production data in real time via QR scanning at every operational stage
- Measure actual fabric usage against CAD marker requirements and surface variance by style
- Track operator-level productivity and efficiency objectively across all processes
- Enable structured end-bit management and measurable wastage recovery
- Automate production reporting and real-time WIP visibility with zero manual consolidation
- Provide reliable, traceable data inputs for Performance Incentive Bonus (PIB) calculation
- Standardize operational discipline through mandatory digital process checkpoints
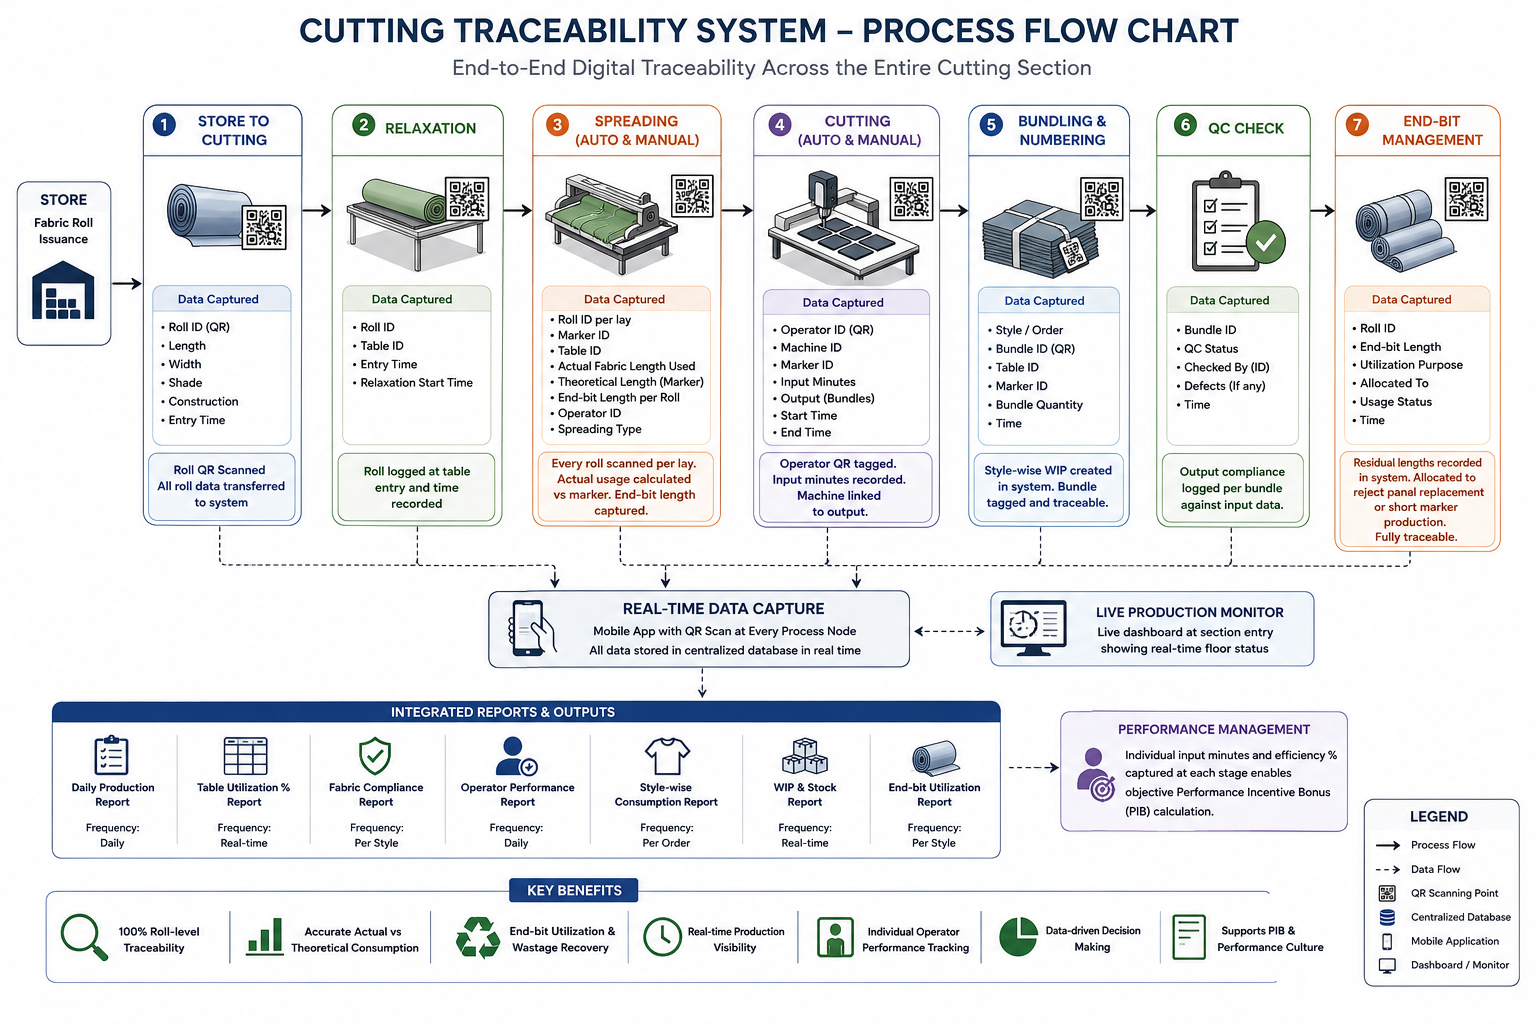
Each QR code on a fabric roll carried structured production data needed at the point of scan. Every field was agreed through requirements sessions with warehouse management, cutting supervisors, and QA. Nothing was included unless a specific downstream workflow required it.
- Roll identity
- Fabric width & roll length
- Shade information
- Fabric construction
- Entry timestamp
- Table assignment
- Roll location
- Entry time
- Process duration
- Roll usage by lay
- Marker association
- Actual fabric length consumed
- End-bit length per roll
- Operator involvement
- Machine association
- Operator identification
- Machine identity
- Input minutes
- Production output
- Timestamp records
- Bundle identity
- Style information
- Quantity
- Process linkage
- WIP status
- Bundle compliance status
- QC verification records
- Defect linkage
- Output approval
End-bit Management: Residual fabric lengths digitally tracked and allocated for reject panel replacement or short-marker production. Reallocation purpose, utilization history, and recovery tracked per roll, eliminating previously untraceable end-bit loss and establishing measurable wastage recovery control.
| Component | Description | BA Contribution |
|---|---|---|
| Mobile Application | Purpose-built for cutting floor operatives. Handles all QR scanning, data capture, and process stage transitions. | Workflow and UX requirements elicited through floor observation and specified as developer build spec |
| Centralized Production Database | Receives timestamped scan transactions from all stages. Real-time data availability across all floors. | Data model and transaction logic specified and handed to developers as formal requirements |
| CAD Marker Integration | Links spreading consumption data to marker specifications for actual vs theoretical comparison. | Integration requirements and data mapping defined through elicitation with CAD and warehouse teams |
| Digital Reporting Engine | Generates all 7 operational and management reports automatically with zero manual consolidation. | Report structure and output format designed and specified as build requirements |
| Real-Time Monitoring Displays | Live dashboards surfacing production status, WIP, and operator performance to supervisors and management. | Dashboard layout and KPI selection designed through elicitation with supervisors and management |
BA Deliverables. Designed and produced across the project lifecycle: end-to-end process maps for all 6 cutting stages (developed through direct floor observation); QR data structures for roll identity and scan transactions at every stage; Standard Operating Procedures (SOPs) for scanning compliance embedded into each operational stage; report and dashboard layouts handed to developers as formal build specifications; and UAT coordination across all cutting floors and both factories.
Two problems emerged during implementation. One hit adoption from the start of deployment. The other appeared as a network infrastructure gap after go-live. Neither was resolved by communication or instruction alone; both needed structural changes.
Challenge: The cutting floor workforce operates at field level, physically handling fabric rolls, operating spreading machines, managing lays, and processing bundles. These are not desk-based or administrative roles. Expecting operatives to carry and manage personal smartphones during production introduced an adoption barrier that had nothing to do with willingness or capability. Staff did not have devices, had no natural place to charge them during a shift, and the physical demands of cutting floor work made personal device management impractical. Initial adoption resistance was observed across multiple floors in the early deployment phase.
Diagnosis: The implementation team identified that resistance was not a change management problem, it was an infrastructure problem. The system was correctly designed, but the deployment model assumed device access that floor staff did not have. Solving it with training or communication would have failed. The correct response was to remove the barrier entirely.
Action: Two dedicated mobile phones were deployed on every cutting floor, owned and managed by the operation, not by individual staff. Charging ports were installed at every production table, ensuring devices were always powered and available at the point of work. This eliminated every physical barrier to adoption: staff no longer needed personal devices, no longer needed to manage charging, and no longer needed to carry anything beyond their normal workflow.
Challenge: Network connectivity gaps were identified across parts of the cutting floors after system go-live. The warehouse and cutting floor environment, large floor plates, structural elements, and equipment density, created areas where mobile data connectivity was insufficient for reliable scan transactions. This was not identified during the requirements phase and surfaced only through operational use after deployment.
Action: Connectivity gaps were logged against specific scan failure locations to map coverage against floor geography. IT infrastructure and floor supervisors were coordinated to prioritise remediation by affected area, ensuring the highest-impact zones were addressed first. IT was engaged to assess and deploy additional network infrastructure to close the identified gaps.
Both challenges shared the same diagnostic structure: a legitimate operational barrier that could not be resolved through instruction. Each required identifying the structural gap first, a device access gap, a network coverage gap, and closing it with the appropriate physical or infrastructure response.
Every operational and management report was generated from live scan data. Manual consolidation was eliminated. No report required any manual input after the point of capture.
| Report | Frequency | Purpose |
|---|---|---|
| Daily Production Report | Daily | Automated production visibility, replaces manual end-of-shift consolidation |
| Table Utilization Report | Real-time | Resource optimization, identifies underutilized spreading stations |
| Fabric Compliance Report | Per Style | Actual vs theoretical consumption control per CAD marker |
| Operator Performance Report | Daily | Individual efficiency monitoring and PIB input data |
| Style-wise Consumption Report | Per Order | Full actual vs theoretical comparison for order-level fabric accountability |
| WIP and Stock Report | Real-time | Live planning coordination, visibility of bundles in-process and completed |
| End-bit Utilization Report | Per Style | Wastage recovery management, tracks residual length allocation and reuse |
One lasting outcome was objective, measurable operator performance tracking as the data foundation for PIB calculation. Before the system, incentive decisions relied on supervisor estimates. That introduced inconsistency and eroded workforce confidence in how evaluations were made.
Outcome: The traceability system became both an operational control platform and a workforce performance management infrastructure. Objective productivity tracking improved transparency and increased workforce acceptance of performance-based evaluation systems.
- Full roll-level traceability across all cutting floors
- Manual production recording dependency eliminated
- Real-time WIP visibility established
- Daily production reporting automated
- Style-wise consumption accountability created
- End-bit recovery and redeployment tracking improved
- Process compliance standardized through scan checkpoints
- Objective operator performance evaluation enabled
- Data foundation for PIB implementation established
- Planning coordination improved through live WIP visibility
- Management response speed increased via real-time dashboards
- Scalable digital infrastructure across 2 factories and 11 floors
- Production data integrated across all cutting stages
- Sustainable operational digitization standards established
- Scalable model for future manufacturing digitization initiatives
| Measure | Implementation | Status |
|---|---|---|
| SOP Integration | Scanning compliance embedded as standard operating procedure across all stages | ACTIVE |
| Ownership Transfer | Production and IT functions hold operational and technical ownership | ACTIVE |
| Automated Reporting | All 7 management reports generated automatically, no manual intervention required | ACTIVE |
| Real-time Monitoring | Live dashboards embedded in daily operational management routines | ACTIVE |
| Scalable Architecture | System architecture supports additional floors and factory expansion | ACTIVE |
Gap 01 — Network coverage gaps remain an ongoing infrastructure management item. Despite IT remediation following the post-go-live connectivity issues, network coverage across large cutting floor environments is subject to ongoing variability. Structural conditions, equipment repositioning, and floor layout changes can reintroduce coverage gaps. This is not a system design flaw, it is a physical environment constraint. Periodic network audits against scan reliability data are recommended as a standing operational practice rather than a one-time fix.
Gap 02 — Continuous 10-hour device operation accelerates battery degradation and requires active hardware lifecycle management. Dedicated phones deployed on cutting floors operate continuously across full production shifts. This usage pattern degrades battery capacity faster than standard device lifecycles account for. No software mitigation fully resolves this, it is a hardware constraint. A planned device replacement cycle, sized against observed degradation rates per floor, is required to prevent scan reliability from declining as devices age. This should be treated as a recurring operational cost, not a one-time capital item.
Five lessons from this implementation apply across similar digital transformation projects in high-volume garment production.