Monitoring & Visualization System
Before this project, performance evaluation for non-production staff across all support departments ran on supervisor opinion. No KPI standards existed, no methodology was applied consistently, and no data was retained. The practical result: departments doing comparable work scored differently depending on who reviewed them, incentive decisions had no paper trail, and there was no way to track whether performance in any department was improving or declining.
The gap showed most clearly during incentive review cycles. With no scoring model, disputes between staff and HR were routine and hard to settle. Managers could not point to data, and employees had no way to understand what was being assessed or how it connected to their bonus.
The core issue was not that performance was unmeasured, it was that measurement was invisible. Work happened, outputs existed, but no system captured them in a form that could be reviewed, compared, or acted on. The project's mandate was to make performance legible across the entire non-production workforce.
The system covered all non-production departments at Snowtex Group: 24 departments, 77 sections, over 2,000 employees. Each section needed its own KPI structure built around what the roles within it were actually responsible for. Production-floor operators were out of scope; they already had output-based metrics. Production support and management teams were in scope, including Machine Maintenance, which runs floor operations without directly producing output. Every function that had no formal measurement framework was included, making this the broadest KPI design the organization had run.
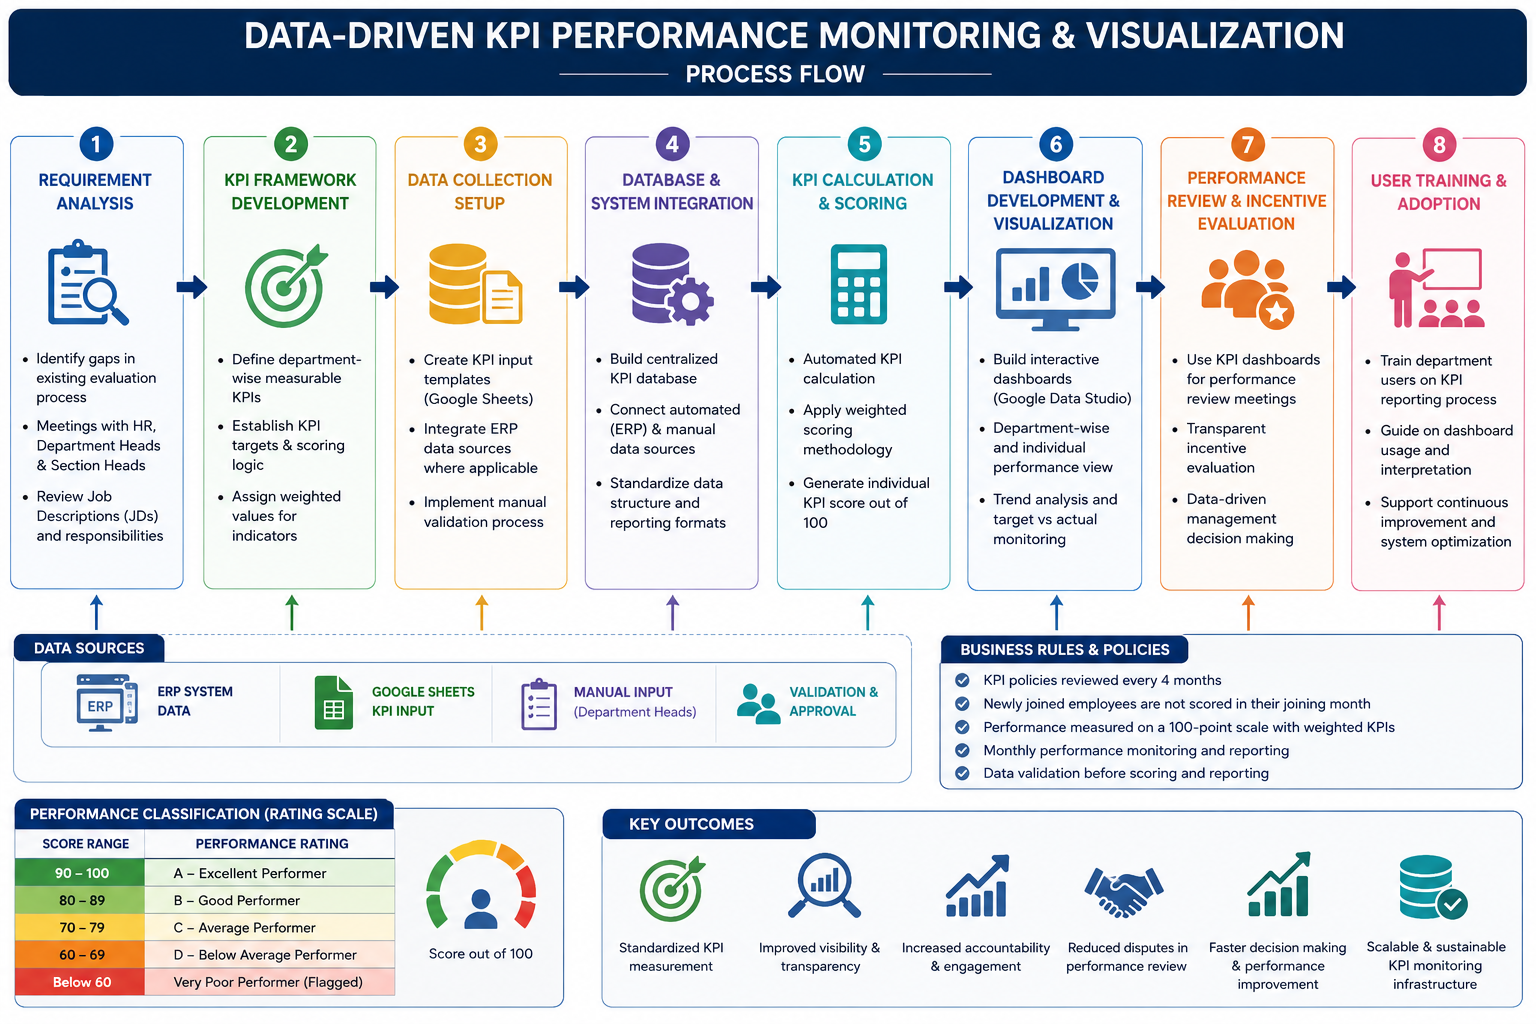
- Define measurable, department-specific KPI indicators for all non-production roles
- Establish a standardized 100-point scoring model with weighted logic where roles have multiple indicators
- Build data collection infrastructure integrating ERP exports, automated feeds, and validated manual submissions
- Develop interactive dashboards providing real-time and monthly performance visibility at individual and department level
- Support objective, data-backed incentive evaluation, eliminating disputes caused by subjective scoring
- Deliver end-user training sufficient for department heads to operate the system independently
The project ran across eight phases, each requiring a signed-off deliverable before the next started. KPI indicators were locked before any tooling was built. Measurement templates were validated before the central database was assembled. The database was complete before dashboards were designed. Nothing started on an unconfirmed output.
All 24 departments and 77 sections needed separate KPI structures. The approach was the same each time: review job descriptions, identify what the role was accountable for, determine what was measurable, set a target. Quality Control and Assurance was the hardest department to design for. It had the most sections, the most cross-functional dependencies, and the most contested indicator in the whole framework. Where roles had multiple indicators, weights were set by strategic importance and signed off by the department head and HR before anything was locked.
| Department | KPI Indicators | Data Source | Scoring Notes |
|---|---|---|---|
| Quality Control & Assurance | Budget vs Realization; defect rate; audit pass rate | ERP cost module + audit records | Budget vs Realization was the most contested indicator in the project, resolved through stakeholder counseling sessions (see §3) |
| Machine Maintenance (Production Management Team) | Machine downtime rate; on-time machine readiness for production | ERP (machine logs) + manual downtime report | Two indicators with agreed weights; downtime carries higher weight given direct production impact |
| Accounts | Invoice processing accuracy; on-time submission rate | ERP finance module export | Accuracy calculated as error-free invoices / total invoices processed |
| Technical Team | Problem resolution rate; response-to-resolution cycle time | Validated manual submission by section head | Resolution rate is the primary indicator; cycle time secondary |
| Sample (R&D Section) | On-time sample delivery rate; sample approval pass rate | Merchandising ERP data + manual buyer feedback log | Pass rate uses buyer approval records; on-time calculated against committed delivery date |
| HR | Recruitment fulfilment rate; employee support resolution rate; JD & organogram implementation % | HR module export + validated manual submission | Three indicators; weights agreed with HR Lead and factory management |
| Information Technology | On-time problem resolution rate; module delivery on-time rate | IT helpdesk log + validated manual submission by IT head | Two indicators; problem resolution weighted higher given direct operational dependency across all departments |
| Industrial Engineering | Line balancing rate; cost vs earning variance | Production floor IE records + ERP finance module | Cost vs earning variance measures efficiency of IE interventions; line balancing rate derived from production output and manpower records |
| All Other Departments | Department and section-specific operational KPIs | ERP (where available) + validated manual submission | 17 additional departments including Compliance, Logistics, Merchandising, Planning, Warehouse Management, and others; each section designed independently; all normalized to 100-point scale |
The most consequential design decision was anchoring KPI selection to existing data rather than ideal data. Every indicator in the framework was chosen because the data to measure it either already existed in the ERP or could be submitted by someone who already tracked it. This eliminated the adoption barrier that comes from asking departments to create new data capture processes.
The central database pulled from three input types. ERP exports fed automated data for departments the system already tracked: Machine Maintenance logs, Accounts invoice records, Sample section merchandising data, HR module. Google Sheets templates collected manual data for roles and events the ERP did not capture. Before any manual submission entered the database, the relevant department head signed off. This kept unverified data out of scores.
Each employee got a single monthly output: their weighted composite score on the 100-point scale. Raw indicator values were stored alongside it so any disputed score could be traced directly to source data.
The most consequential conflict came during KPI framework design. One proposed indicator affected all 24 department heads at once, required several resolution sessions, and came closest to derailing the project timeline. It is documented in full below because it captures the hardest part of KPI work: persuading stakeholders to be measured on something they believe they do not control.
Conflict: During P-02 KPI framework design, the inclusion of a "Budget vs Realization" indicator for all department heads was proposed by senior management as a core cost optimization metric. All 24 department heads raised objections. Their position rested on two arguments: first, that budget decisions were made above their level, so holding them accountable for budget variance was unfair; second, that there were too many cost variables outside their operational control, market prices, procurement decisions, organizational directives, making the target impossible to achieve consistently.
Why the indicator mattered: Senior management and the QC & Assurance department head (where cost control was most critical) held that Budget vs Realization was the most important indicator in the entire framework for driving cost optimization. Removing it would have stripped the KPI system of its most direct link to organizational cost performance. Modifying it to a weaker form would have undermined its purpose.
BA Action: The BA conducted multiple counseling sessions with both sides, department heads and senior management, rather than attempting to resolve the conflict through a single meeting. The sessions with department heads focused on breaking down what the budget actually contained. The BA walked through the budget line by line with the department heads and demonstrated that a significant portion of every departmental budget was made up of costs they did control directly: manpower deployment decisions, stationery and consumable usage, and process-level operational expenses. These were not costs set by procurement or finance, they were day-to-day operational decisions made by the department heads themselves.
BA Action (continued): The BA then reframed the indicator. Budget vs Realization was not asking department heads to control costs set above them. It was asking them to identify and act on optimization opportunities within the cost lines they already managed, specifically manpower efficiency and process automation. The sessions showed that departments which had previously automated manual processes or optimized shift structures had demonstrably better budget realization records. The indicator was therefore a measure of operational leadership, not of financial authority.
The resolution of this conflict was not procedural, it was analytical. The department heads' objection was reasonable on the surface: if you don't control the budget, you shouldn't be scored against it. The BA's role was to demonstrate, with the actual budget data, that they controlled more of it than they believed. That reframe, from "unfair accountability" to "visible opportunity" — was what made the indicator acceptable without modification.
| Objective | Delivered | Measured Impact | Measurement Basis | Status |
|---|---|---|---|---|
| Standardized KPI measurement across all non-production departments | KPI frameworks defined and operational for all 24 departments and 77 sections; all roles evaluated on a 100-point scale | Departments with a formal KPI model: 0 → 24. Sections covered: 0 → 77 | Baseline confirmed in P-01 elicitation: zero existing frameworks. Post: all departments operational at go-live | ACHIEVED |
| Reduce subjectivity in performance evaluation | All scores derived from data (ERP or validated manual); no discretionary scoring input permitted in the model | Evaluation disputes in first two post-launch review cycles: 0 | HR self-reported. Prior cycles averaged 3–5 informal disputes per review. Not independently audited. | ACHIEVED |
| Enable real-time and monthly performance visibility | Google Data Studio dashboards live: individual and department views, monthly trend panels, incentive eligibility indicators | Management access to performance data: monthly report → same-day dashboard | Before: performance data available only after monthly Finance close. After: dashboard refreshes on data submission cadence confirmed by HR Lead | ACHIEVED |
| Support objective incentive evaluation | Incentive eligibility derived directly from KPI scores; scoring logic documented and auditable; HR confirmed use of dashboard in first live incentive cycle | Incentive review time: multi-day manual review → same-session dashboard review | Self-reported by HR Lead across first two post-launch incentive cycles. Directional, not independently measured. | ACHIEVED |
Three decisions made during the design phase determined the long-term integrity of the framework. Each addressed a question that KPI systems commonly leave unanswered, what the score means, what happens to new employees, and how the framework stays current over time.
The problem it solved: A score out of 100 is only useful if every manager interprets it the same way. Without a defined classification, a score of 74 might be considered acceptable by one department head and a concern by another, producing inconsistent management responses across 24 departments.
Decision: A five-band performance classification was defined and embedded in the dashboard before go-live. Every employee score is automatically classified on the following scale:
A (90–100) — Exceptional performance. B (80–89) — Above expectations. C (70–79) — Meets expectations. D (60–69) — Below expectations, improvement required. Below 60 — Flagged as very poor performer; escalation to HR and department head required.
The problem it solved: Employees who join mid-month have not had a full period to perform against their KPI targets. Scoring them in their joining month against a full-month denominator would systematically produce low scores that do not reflect actual performance, and could unfairly affect their first incentive assessment.
Decision: New employees are explicitly excluded from KPI scoring in their joining month. Their first scored period begins in the first full calendar month following their joining date. This rule was defined as a policy parameter in the framework specification, not left to individual manager discretion.
The problem it solved: A KPI framework designed once and never revisited becomes misaligned with operational reality over time. Targets set at launch may become too easy or too hard as business conditions, staffing, and organizational priorities shift. A static framework loses credibility with department heads and employees alike.
Decision: A formal 4-month review cycle was established as part of the system governance. Every four months, individual KPI policies, targets, weights, and indicator definitions, are reviewed by the relevant department head, HR, and senior management. Changes require documented justification and formal sign-off before taking effect. The review cadence is fixed; it is not triggered ad hoc by individual department requests.
The system was designed to be operational as quickly as possible using existing infrastructure. Two architectural limitations are known, acknowledged, and are being addressed in the next phase of development.
The limitation: All KPI submission templates, score calculation logic, and the central database are currently built on Google Sheets. This was the correct decision for a first-generation system, it allowed rapid deployment without requiring ERP development time or budget. However, Google Sheets introduces two structural constraints that become more significant as the system matures.
Scalability: Managing 24 department submission templates and a centralized database across 2,000+ employees in Sheets becomes progressively harder to maintain as headcount grows, new sections are added, or the review cadence increases. Formula integrity and access control are difficult to enforce at scale without ERP-level data governance.
Audit trail: Manual submissions validated by department heads provide a process-level check, but Sheets does not provide the immutable, timestamped data lineage that an ERP system does. If a score is disputed and the underlying data has been edited, even legitimately, the Sheets environment cannot reconstruct the original entry with confidence.
The gap: The full KPI system, submission templates, weighted score calculation logic, policy parameters, and Google Data Studio dashboards, is planned for migration into the organization's ERP. The target state is an end-to-end ERP-native system where data entry, score calculation, and performance reporting all operate within a single governed platform, eliminating the dependency on Google Sheets entirely.
Current status: Migration is in progress. Approximately 5% of measurement reports have been transferred to ERP as of the current reporting period. The remaining 95% of the system continues to operate on the existing Google Sheets and Google Data Studio infrastructure. Migration is a phased process, departments with higher ERP data coverage are being prioritized.
Impact of the gap: Until migration is complete, the system operates across two platforms. ERP for source data capture in some departments, Sheets for score calculation and submission across all departments, and Google Data Studio for dashboards. This split architecture requires manual coordination at the integration points and limits the audit traceability that full ERP operation would provide.