Analytics System
NOTE ON METRICS METHODOLOGY — The $60M figure is derived from the annual factory wage and overhead budget as filed by Finance, not from system-generated totals. Reporting effort reduction (≥60%) is self-reported by the Finance Lead across three post-go-live close cycles and has not been independently audited. All figures are directionally reliable; precision claims should be treated accordingly.
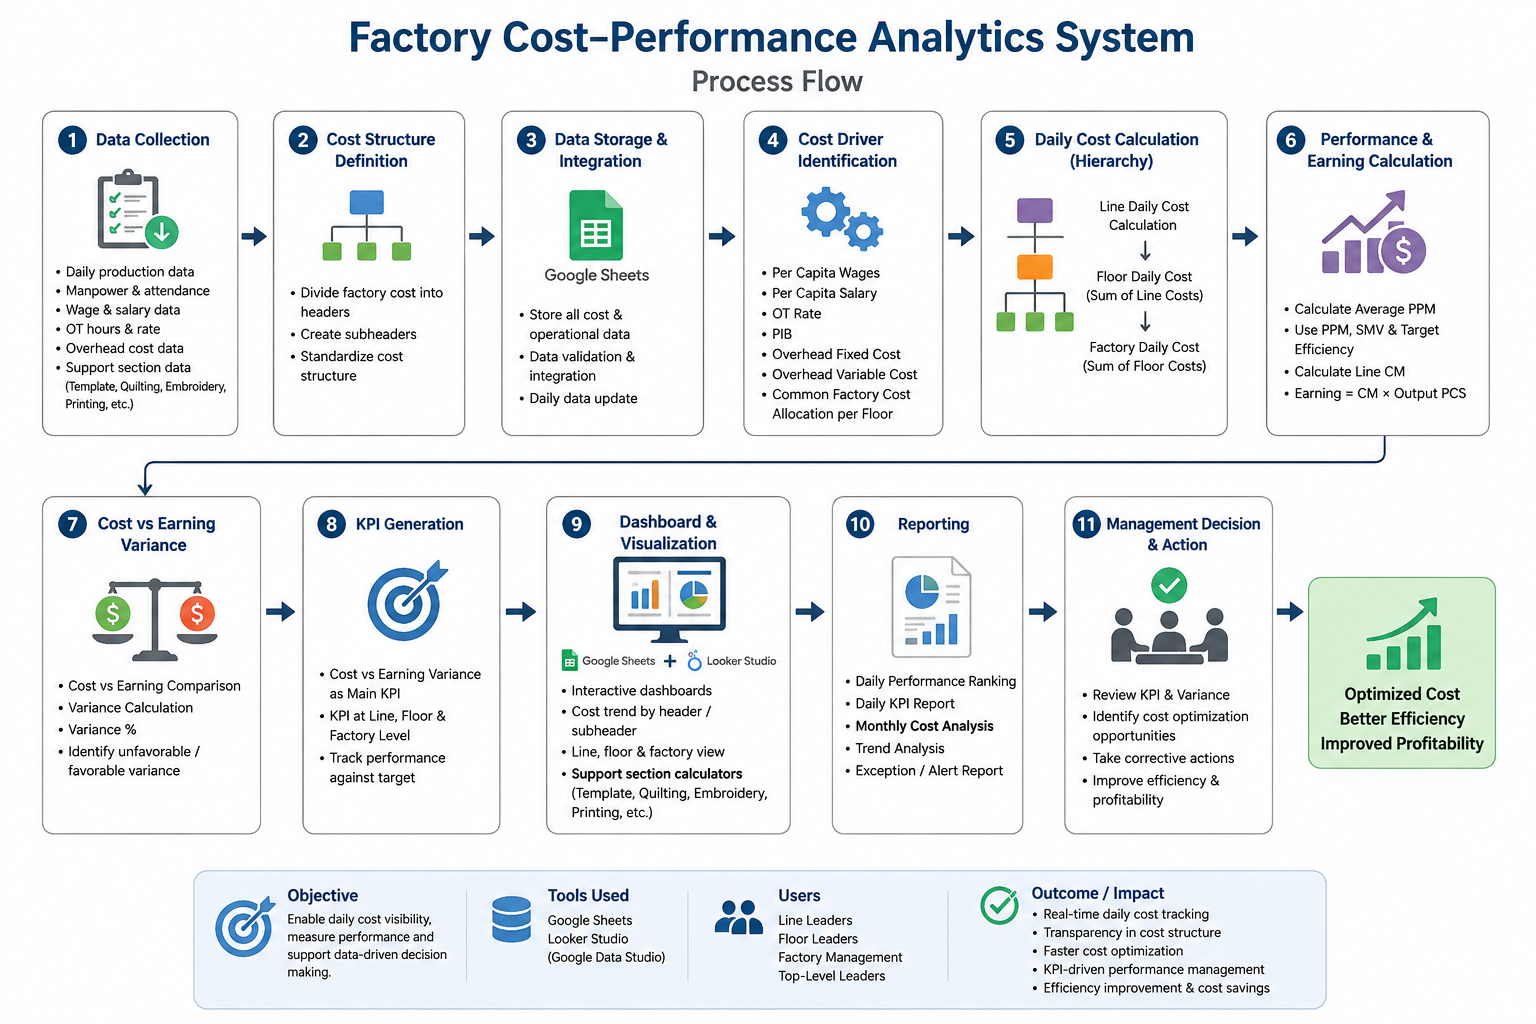
The organization is a large garment manufacturer running multiple production floors, each with multiple sewing lines, supported by template, quilting, embroidery, and printing sections. Hundreds of operators and supervisors feed a cost structure covering wages, overtime, PIB entitlements, and shared factory overheads.
ROOT CAUSE: Cost and production data existed in structural isolation from each other. No system connected what a line cost to run with what it produced, making it impossible to measure cost efficiency at the level where operational decisions are actually made. Management received a single consolidated monthly P&L, with no line or floor breakdown, arriving 15–25 days after the period had closed.
| Dimension | Before FCPA (As-Is) | After FCPA (To-Be) |
|---|---|---|
| Reporting frequency | Monthly only — 15–25 day lag after period close | Daily, same-day cost visibility at line, floor, and factory levels |
| Reporting granularity | Factory aggregate only, no floor or line breakdown | Line → Floor → Factory, three levels simultaneously, all reconciled |
| Cost–performance link | Finance and IE data in separate silos. CVE structurally impossible | CM (from IE PPM × SMV/planned efficiency) joined to cost. CVE computed per line daily |
| Allocation disputes | PIB and common cost applied differently by Finance and Operations, figures diverged 10–18% | Single agreed cost structure, joint sign-off, zero disputes post go-live |
| Support sections | Template, Quilting, Embroidery, Printing, zero structured cost model | 4 dedicated calculators, per-job cost output, co-designed with section heads |
| Month-end close | 2–3 days of Finance manual compilation per cycle (~5–7 hrs/day effort) | Same-day auto-generated. Finance validates rather than compiles |
| Shift prioritization | ~40 min manual multi-spreadsheet exercise every morning | <30 seconds, auto-ranked CVE report in Google Data Studio |
| Header | Calculation Logic | Allocation Basis |
|---|---|---|
| 01 · Per Capita Wages | Operator-level manpower wages ÷ Operator headcount | Direct to line by operator headcount |
| 02 · Per Capita Salary | Staff salary ÷ Staff headcount | Direct to line by staff headcount |
| 03 · Overtime (OT) | OT Hours × Base Rate × Line operator count | Direct to line |
| 04 · PIB | Total PIB ÷ Total factory operator headcount | Fixed per operator — CONFLICT 01 resolution |
| 05 · KPI Amount | Total KPI amount ÷ Total factory staff headcount | Fixed per staff |
| 06 · Fixed Overhead | Total fixed overhead cost ÷ Total headcount of the factory | Headcount-weighted across lines (depreciation, maintenance) |
| 07 · Variable Overhead | Total variable overhead cost ÷ ( Total headcount × Total Factory Available hours ) | Activity-based (consumables, energy, accessories) |
| 08 · Common Factory Cost | Overall factory cost ÷ Total lines | Equal per line — CONFLICT 02 resolution |
| Metric | Formula | Target / Alert Threshold | Owner |
|---|---|---|---|
| Cost of Making (CM) | (PPM × SMV ÷ Planned Efficiency) — IE Lead co-signed formula | IE-set target; deviation flagged | IE Team |
| Daily Earnings | CM × Actual Output (pcs) | Benchmarked against daily cost | IE + Finance |
| CVE (primary KPI) | Daily Earnings − Daily Total Line Cost | Target ≥ 0. Decision protocol not yet implemented, see §4 Gap 03 | Factory Mgmt |
| CVE% (variance rate) | ( CVE ÷ Daily Total Line Cost ) × 100 | Warning: <−5%. Critical: <−10% | Factory Mgmt |
| ID | Requirement | Priority | Acceptance Signal. Including Edge Cases Tested |
|---|---|---|---|
| FR-01 | Standardized cost structure with agreed headers applied consistently across all lines | MUST | Finance Lead + Ops Head sign-off before build. Edge: supervisor shared across two floors, allocation rule documented and applied consistently in test data. |
| FR-02 | Daily cost computed per line across all eight headers, each component as an independent column before summation | MUST | 20 test records match manual calculation 100%. Edge cases included: 3 zero-output days (variable overhead headcount and hours base still applies); 1 OT-free day (OT column = 0, no formula error). Zero hardcoded rates. |
| FR-03 | Line costs aggregated to floor total, then consolidated to factory, three-tier reconciliation enforced | MUST | Factory total = sum of all floor totals on all test dates. Auto-reconciliation flag tested: deliberately introduced a mismatch on Day 7 — flag fired. Edge: floor with a single line, aggregation and reconciliation still operational. |
| FR-04 | Month-to-date running cost accumulation at line, floor, and factory level | MUST | MTD total verified to reset at month boundary in UAT. Edge: mid-month go-live. MTD accumulation starts from day of first entry, does not backfill; documented as expected behaviour for Month 1. |
| FR-05 | Cost of Making (CM) derived from IE PPM, SMV, and planned efficiency. IE Lead co-signed formula | MUST | CM validated against IE manual calculation for 20 test records — 100% match. Edge: blank PPM entry. CM returns error flag (not zero), preventing silent propagation. Note: this edge case was identified during UAT, not elicitation, see §4 Gap 02. |
| FR-06 | CVE model: Daily Earnings vs. Daily Cost at line, floor, and factory, negative lines visually flagged | MUST | CVE validated against expected values 100%; floor CVE = sum of line CVEs confirmed. Edge: all lines on a floor negative, floor CVE flag escalated to factory-level summary. Conditional formatting tested in Google Data Studio. |
| FR-07 | Support function calculators for Template, Quilting, Embroidery, and Printing, co-designed with section heads on the floor | MUST | Per-job cost within ±5% of historical estimates across 10 test jobs per section. Section heads operated calculators independently in UAT without BA assistance. Edge: job spanning two cost categories (e.g. template + embroidery) — calculators kept independent; cross-section jobs require two entries by design, documented in handover. |
| FR-08/09 | Daily CVE ranking report + auto-generated monthly cost summary, zero manual preparation at go-live | SHOULD | Ranking refreshes in Google Data Studio without manual step, verified with IE team on three consecutive mornings post go-live. Monthly summary generated from accumulated data in UAT cycle; Finance Lead confirmed format matches reporting requirement. |
| FR-10 | Google Data Studio dashboard suite: Factory Command Center, Floor Performance, Line Analyzer, Daily Ranking, Monthly Analysis, Support Calculators | MUST | 3 management users completed all 5 UAT navigation tasks without assistance. Updates auto-propagate on data entry, verified with 2-minute propagation test. Edge: user with view-only access attempts filter that requires edit access, graceful degradation confirmed. |
| ID | Category | Requirement | Acceptance Threshold | Status |
|---|---|---|---|---|
| NF-01 | Timeliness | Daily cost report must be fully calculated and available in Data Studio before 2:00 PM the following day, in time for top management review meeting. | Report accessible by 2:00 PM next day on all working days. Verified across 10 consecutive days post go-live. | MET |
| NF-02 | Maintainability | All cost calculation rates must be formula-driven. Zero hardcoded values permitted. Any rate change (wages, overhead, material cost) must propagate automatically across all lines without manual formula editing. | Rate change applied in one cell propagates correctly to all 20 test lines within the same data refresh cycle. Verified during UAT. | MET |
| NF-03 | Data Integrity | System must produce consistent, non-contradictory figures across all three reporting levels — line, floor, and factory — with no manual aggregation step between levels. A line-level figure must sum precisely to its floor total; floor totals must sum precisely to the factory figure. | Zero reconciliation gap across all three levels on 20 UAT test records. Finance Lead confirmed match to manual calculation at factory level. | MET |
| NF-04 | Usability | Management-level users must be able to navigate the dashboard and read all KPI outputs without BA involvement or technical training. System must be self-explanatory at point of use. | 3 management users completed all 5 UAT navigation tasks without assistance. No BA present during UAT navigation test. | MET |
| NF-05 | Accuracy | Finance and Operations cost figures must reconcile within the agreed tolerance before the system is accepted as the single source of truth. Any divergence above threshold must surface as a visible flag, not a silent calculation error. | 10–18% pre-project divergence resolved to agreed cost structure before build. Blank-entry error flag (NF-05 edge case) confirmed in UAT after GAP 02 remediation. | MET |
The first requirement sessions revealed a structural problem: Finance owned the cost numbers, IE owned the performance numbers, and neither team had previously been asked to connect them. Building a credible CVE model required both functions to validate their inputs and formally agree on how the two datasets joined. Running joint Finance-IE sessions, rather than meeting each function separately, was what made the model trustworthy at month-end close.
| Session | Stakeholders | Purpose | Output / Decision |
|---|---|---|---|
| S-01 · Discovery | Factory Management | Define scope, success criteria, and non-negotiable constraints | Signed project brief; confirmed daily line-level visibility as primary objective; cost data confidentiality constraint established |
| S-02 · Cost Structure Design | Finance Lead, Operations Head | Enumerate cost headers, define allocation logic, surface conflicts | 8 cost headers agreed in draft; CONFLICT 01 (PIB) and CONFLICT 02 (Common Cost) identified and flagged for dedicated resolution |
| S-04 · CM Formula Co-Design | IE Lead | Define Cost of Making formula from IE's PPM and SMV data | CM formula agreed and signed off by IE Lead. Input fields confirmed against data IE already records daily, no new data capture required |
| S-05 · CVE Model Validation | Finance Lead, IE Lead | Joint validation of CVE calculation joining Finance cost to IE earnings | CVE formula validated against one month of actual data by both functions. Minor rounding disagreement surfaced and resolved, see CONFLICT 03 |
| S-06–09 · Calculator Co-Design | Template, Quilting, Embroidery, Printing Section Heads (one session per section) | Identify existing data each section records; co-design calculator inputs around that data | 4 calculators scoped with inputs sections already track. Design principle: zero new data capture requirements. All four section heads confirmed input fields in session |
| S-10 · Dashboard Design Review | Factory Management, Floor Managers | Review Google Data Studio wireframes; confirm layout and metric priority per page | CVE ranking moved to dashboard landing page per Factory Management request. Floor Managers confirmed line-level drill-down as primary daily use case |
| S-11 · UAT | Finance Lead, IE Lead, 3 Management Users | Calculation verification (20 records) and usability testing (5 tasks) | All 20 calculation tests passed. All 5 usability tasks completed without BA assistance. Blank PPM propagation bug identified and fixed, see §4 Gap 02 |
Conflict: Finance allocated PIB proportionally to output, lines producing more pieces received a higher PIB cost. Operations argued PIB should be a fixed cost per operator, regardless of output. Applied to the same line, the two methods produced figures diverging by up to 18%, making Finance and Operations cost reports fundamentally at odds at every month-end close.
BA Action: Dedicated resolution session (S-03) with Finance Lead and Operations Head. Both allocation methods modelled side-by-side using one month of actual data, quantifying the variance on a per-line basis. Business logic of each approach documented: output-proportional reflects how PIB is earned but introduces variability that makes the cost component difficult to audit and predict; fixed-per-operator (Total PIB ÷ Total headcount) is stable, auditable, and directly traceable to the payroll record without requiring daily output as an input to a cost calculation.
Conflict: Common factory costs (shared services, utilities, facility) were to be allocated across production floors. Finance proposed equal allocation per floor, simple and defensible. Operations argued that floors with higher headcounts should bear a proportionally larger share. The two approaches produced floor-level cost figures differing by 12–15% on the same cost pool.
BA Action: Both approaches modelled against actual floor headcount distribution. Implications documented: equal allocation is simpler to explain and maintain; headcount-weighted allocation more accurately represents resource consumption but requires headcount data as a maintained configuration input. Findings presented to Finance and Operations jointly in S-03.
Conflict: During CVE model validation (S-05), Finance and IE produced CM figures that matched conceptually but differed by BDT 0.03–0.12 per piece depending on the line, caused by Finance rounding wage rates to two decimal places while IE carried four. Across a high-volume line, this produced a daily CVE variance of BDT 200–400 — enough to flip a line from marginally positive to marginally negative CVE.
BA Action: Both rounding conventions documented and the downstream CVE impact quantified on one month of actual data. Materiality threshold discussed with Finance Lead: BDT 400/day on a line running BDT 80,000+/day is <0.5% variance. Rounding convention decision escalated to Finance Lead as owner of the model's precision standard.
The highest-consequence risk on this project was a cost allocation dispute invalidating the model before a single dashboard was built. Resolving all three conflicts formally, before or during the build, converted potential post-launch contestation into pre-launch alignment. A model built on disputed allocation logic would have been challenged by one function at every management review.
| Objective | Delivered | Measured Impact | Measurement Basis | Status |
|---|---|---|---|---|
| Establish daily cost visibility at line, floor, and factory level | Real-time CVE dashboard operational across three levels; MTD accumulation running | Decision lag: 18-day avg → 0 days | Baseline: Finance close-completion log, 6 cycles pre-deployment. Post: dashboard access confirmed daily by IE team | ACHIEVED |
| Implement CVE model as primary KPI at all levels | CVE calculated daily at line, floor, and factory; negative-CVE lines identified in real time; daily ranking report operational | Shift prioritization: 40 min manual → <30 seconds | Before: Operations Manager self-reported timing, corroborated by IE team. After: timed by BA during S-11 UAT | ACHIEVED |
| Develop support function calculators for all four sections | Template, quilting, embroidery, and printing calculators built and handed over; all four section heads operate independently | Sections with structured cost model: 0 → 4 | Baseline: confirmed in S-06–09 discovery that zero sections had an existing cost model. Post: UAT confirmed independent operation | ACHIEVED |
| Reduce manual financial reporting effort by ≥60% | Automated cost calculation eliminates daily Finance compilation; auto-generated monthly summary replaces 2–3 day manual close | Month-end close: 2–3 days → same-day. ~5–7 hrs/day reduced by ≥60% | Self-reported by Finance Lead across 3 post-go-live close cycles. Not independently audited, directional, not precise. | ACHIEVED |
The following are not lessons learned. They are requirements gaps that went unidentified during elicitation and emerged during or after delivery. They are documented here as gaps, not reframed as retrospective wisdom.
Gap That Shipped
Finance was engaged to validate the first-draft cost model, not during its design. This produced a revision round on rounding convention (CONFLICT 03) and PIB formula structure that a single earlier workshop would have surfaced. The rework added an estimated two days to the build phase and introduced a brief period where the model existed in a state Finance had not yet reviewed.
What should have happened: Finance as co-designer from Session 1, not downstream reviewer. The S-02 session should have included Finance in active cost structure design rather than presenting a draft for comment.
Gap That Shipped
A blank PPM entry propagated silently through the CM calculation for three days before detection during UAT. The system calculated CM using the blank field as zero, producing a CM of zero and a deeply negative CVE, without any flag. The error was caught because a UAT tester noticed the CVE value was anomalous, not because the system flagged it.
What should have happened: Input validation and missing-data flagging scoped as FR-11 during elicitation, not discovered as a bug in UAT. On any system where manual daily data entry is the input mechanism, data quality monitoring is a correctness requirement, not a post-launch enhancement.
Gap That Shipped
The CVE metric was built. The decision protocol was not. The system flags a line as negative-CVE and ranks it at the bottom of the daily report. What happens next, who is notified, at what threshold a supervisor is called, what action is expected after three consecutive negative-CVE days, was not captured as a requirement and is not implemented. Management sees the data; the escalation path exists only informally.
What should have happened: CVE alert thresholds and escalation protocol scoped as FR-12 in S-01 discovery. The question "who acts on a negative CVE line and how?" should have been put to Factory Management before the dashboard was designed, not deferred as a post-launch addition.
The three gaps above represent requirements that were not captured during elicitation, not post-launch optimisations. They are included here because an honest case study documents what was missed, not only what was delivered. GAP 02 was partially remediated in UAT (error flag added to CM formula). GAP 01 and GAP 03 remain open at time of writing and are scoped for the next iteration.