KPI-Based Incentive System
Across 172 woven production lines at Snowtex Group, production performance had no real-time visibility. Supervisors relied on end-of-shift manual tallies consolidated hours after events occurred. Machine breakdowns went undetected until shift-end. Quality defects accumulated before anyone was alerted. Incentive decisions were made on supervisor judgment, not measured output. No consistent method existed for individual operator performance measurement, and there was no data infrastructure to support a pay-linked incentive model. If management wanted to know how many units a line had produced right now, they walked the floor.
The project mandate was to digitize that reality: capture production events in real time, convert them into measurable KPIs, and link those KPIs directly to operator incentives.
All 172 woven production lines, with operator-level performance tracking per line. A pilot was mandated before full deployment: 8 lines selected for initial validation. Stakeholders in scope included production management, Industrial Engineering, Quality Assurance, and IT. The PIB model design was in scope from the start, linking IoT-measured operator data directly to monthly incentive calculation.
- Enable real-time production output visibility across all 172 woven lines through IoT data capture
- Design a standardized KPI framework measuring Production Efficiency (%), DHU, and Target vs Actual performance at the operator level
- Deploy custom IoT devices on every production line to capture output events, machine status, and quality flags through operator input
- Build live dashboards and alert systems for production supervisors and management, with mobile and call notifications for machine breakdowns and quality threshold breaches
- Introduce a transparent, data-driven Performance Incentive Bonus (PIB) system directly linked to IoT-measured individual performance, eliminating subjective incentive assessment
- Validate the system through an 8-line pilot, then scale to full factory deployment and integrate into ERP
- Deliver training and change management for operators and supervisors to ensure adoption without BA dependency at go-live
The project ran across eight phases. KPI logic was finalized before IoT devices were configured. Pilot data was validated before the PIB model went live. HR and production management confirmed the PIB model before the 172-line rollout started. Nothing moved forward on an unconfirmed output.
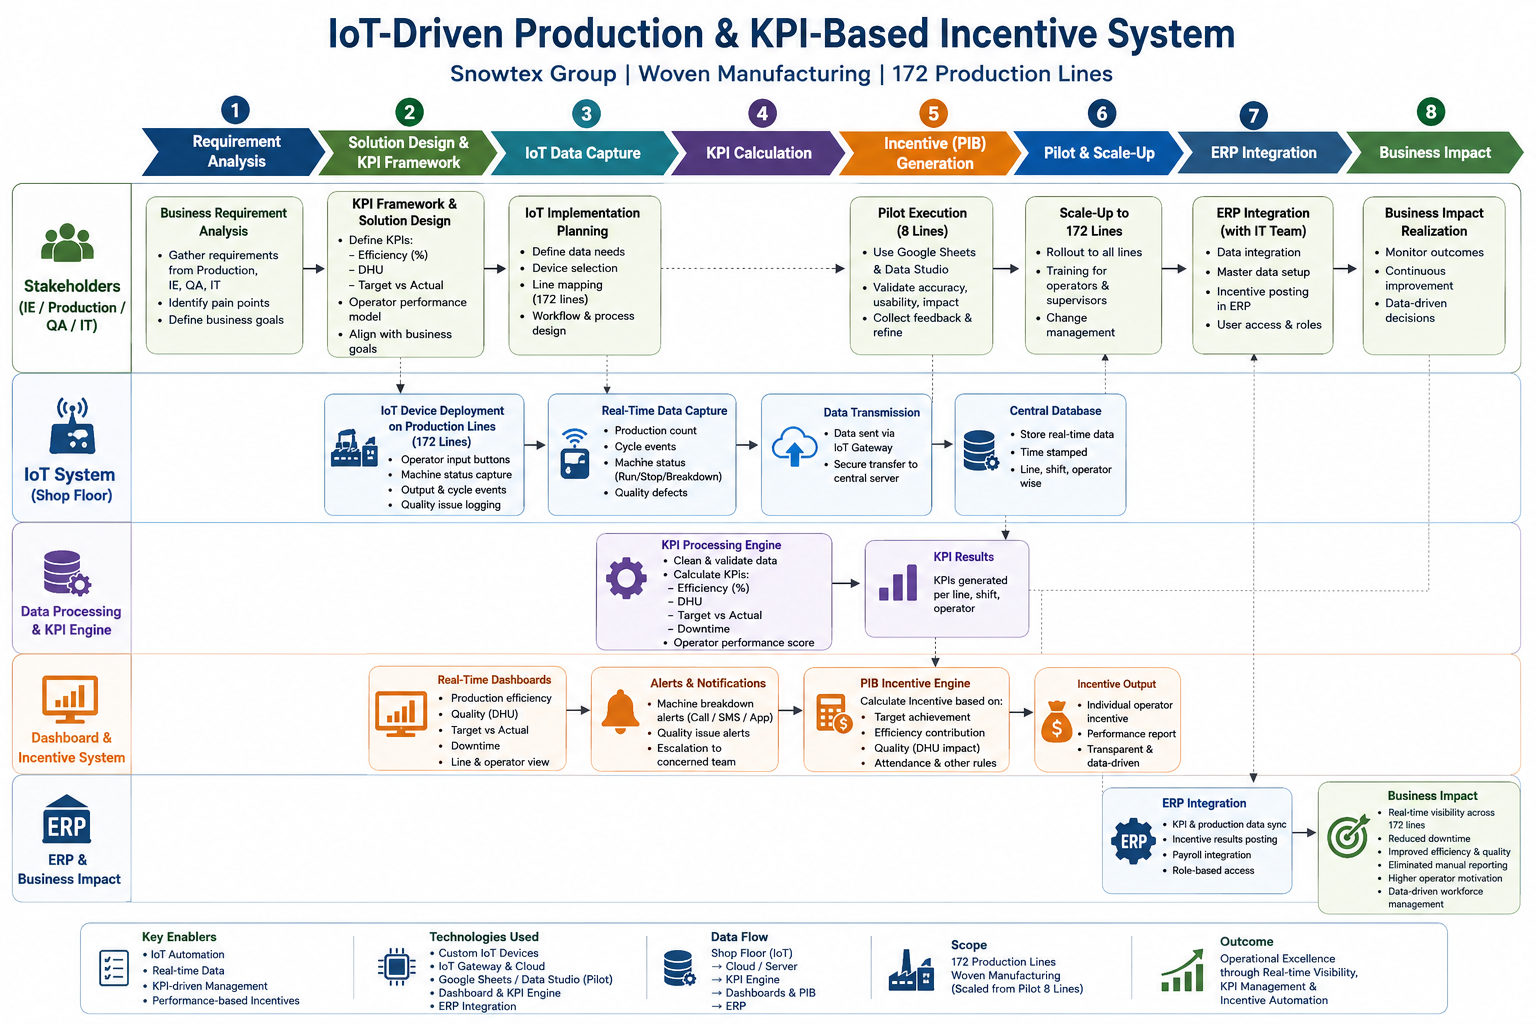
The IoT architecture was built to be simple for operators and rich for analysts. Each operator has a button panel at their workstation that captures production events, machine status, and quality flags. Raw event data flows into a central KPI engine, which calculates real-time performance metrics and feeds both the live dashboard and the PIB calculation model.
The process map covers the full lifecycle from a physical production event on the floor to operator incentive calculation and HR payout, across the IoT layer, the data layer, and the business output layer. End-to-end process mapping was completed in P-03 before IoT device specification or KPI engine design began, and served as the primary reference for IT integration in P-08.
This workflow was the primary integration reference document handed to the IT team in P-08. Steps 01–06 defined the IoT device specification and KPI engine requirements; Steps 07–09 defined the dashboard, alert, and ERP data schema requirements. The process map was also used as the basis for operator and supervisor training, each role was trained on only the steps directly relevant to their interaction with the system.
Three KPIs were designed around events the IoT device already captured; no additional operator input was needed. IE, which held authority over efficiency standards and target-setting, co-defined the logic. Production Efficiency and Target Achievement form the weighted composite score for PIB band placement. DHU is applied as a post-band deduction.
| KPI | Definition | Data Source | PIB Weight | Design Notes |
|---|---|---|---|---|
| Production Efficiency (%) | Actual output ÷ Target output × 100, calculated per operator per shift | IoT device, production count button events vs IE-set hourly targets | 50% | Primary KPI; IE-validated targets set per line and style. Most contested weight in stakeholder alignment, see §3 |
| DHU (Defects per Hundred Units) | Total defects detected ÷ Total units produced × 100, per operator per shift | IoT quality flag button + QA audit records for validation | Deduction Parameter | Quality control mechanism applied after PIB band assignment. If workstation DHU exceeds the defined target, PIB amount is deducted proportionally per policy. Operator-attributable defect scope defined through IE–QA classification framework, see §3 |
| Target Achievement Rate | % of shifts in a month where operator achieved ≥80% of IE-set target | IoT device, shift-level output aggregates vs target threshold | 20% | Measures consistency of performance across the month, not just peak output. Threshold set at 80% after pilot data analysis, see Design Decision 02 |
The PIB system maps the weighted KPI composite score to a monthly incentive band. Band structure was fixed before the pilot to keep allocation non-discretionary. The 80% eligibility threshold came from pilot data: achievable on well-balanced lines, but high enough to distinguish strong performers. Band assignment is automatic; overrides require documented management approval. DHU deduction applies after band placement, keeping efficiency and quality on separate accountability tracks.
The 80% floor was calibrated against pilot data showing that 100% target achievement was regularly disrupted by style changeovers and machine maintenance events outside operator control. A 100% threshold would have rewarded line assignment, not operator performance.
| ID | Category | Requirement | Acceptance Threshold | Status |
|---|---|---|---|---|
| NF-01 | Timeliness | PIB calculation for all active lines must be fully computed and available to payroll by 1:00 PM the following day. Late availability delays payroll processing and breaks the incentive-to-output accountability link the system is designed to create. | PIB figures for all 172 lines available in the system before 1:00 PM next day on all working days. Verified across the first 4 payroll cycles post full deployment. | MET |
| NF-02 | Budget Constraint | No ERP development budget was allocated for the initial deployment phase. All measurement, calculation, and reporting infrastructure must be built within existing Google Workspace tools. No third-party software licensing or custom ERP development permitted in Phase 1. | Full 172-line system operational with zero external software cost. All calculation logic housed in Google Sheets; automation via Google Apps Script. | MET |
| NF-03 | Governance | 8-line pilot must receive formal management sign-off before any factory-wide scaling is initiated. Pilot gate is a hard requirement — scaling without sign-off is not permitted regardless of pilot performance. | Written management approval received after pilot review session. Scaling to 172 lines initiated only post sign-off. Gate enforced as designed. | MET |
| NF-04 | Availability | Line efficiency data must be visible to supervisors during the active shift — not consolidated end-of-shift. Real-time visibility is the core mechanism enabling supervisors to intervene before performance loss becomes unrecoverable. | Line efficiency refreshes visible to supervisors within the same shift period. Confirmed during pilot validation across 8 lines before scaling approval. | MET |
| NF-05 | Transparency | PIB calculation logic must be fully visible and auditable by operators. A system operators cannot verify will not be trusted, and an untrusted incentive system will not change behaviour. No black-box calculation permitted. | Operators in structured sessions could trace their own PIB calculation from raw efficiency input to final figure without BA explanation. Verified during pilot operator sessions. | MET |
Three stakeholder conflicts arose, each at a different phase and involving different groups. All three required structured engagement, not administrative decisions. Each is documented in full because they capture the hardest part of IoT-linked incentive work: getting stakeholders to accept that a machine-generated number will directly affect someone's monthly pay.
Conflict: During the 8-line pilot, operators expressed reluctance to use IoT input buttons consistently, not because they couldn't, but because they feared the data was being logged to build a surveillance record against them, and that accurate output reporting would be used to raise future IE targets. Several operators were strategically under-reporting. This mattered acutely: the entire KPI system, PIB model, and dashboard depended on IoT data accuracy. An architecture with accurate devices but falsified human input produces confident-looking numbers built on bad data, worse than no system at all.
BA Action: The BA held structured operator briefing sessions directly on the floor, not through supervisors, with translators where needed. Sessions explained exactly what the device captured, what it was not used for, and demonstrated PIB calculations using live pilot data: higher reported output produced higher incentive, not a higher target. Concurrently, the BA worked with production management to formally establish a downtime exclusion policy, machine and style changeover events would be flagged in the system and excluded from the efficiency denominator. This was a system design change, not a verbal assurance, and was documented in the KPI specification and communicated to operators as a structural protection.
Conflict: The IE team raised a formal objection to including DHU as a PIB component, arguing that defect rates are influenced by fabric quality, machine calibration, style complexity, and maintenance, factors outside operator control. Their attribution concern was technically defensible. However, QA and production management held that removing DHU from PIB entirely would eliminate the only quality-linked incentive, effectively rewarding fast, low-quality output. Both positions were valid; neither was wrong.
BA Action: The BA facilitated a joint IE–QA working session to define the boundary between operator-attributable and externally caused defects. The session produced a classification framework: defects from fabric quality, machine miscalibration, or style instruction errors were excluded from the operator DHU score; only defect types both teams agreed were within operator control, stitch skipping, thread breakage from improper handling, seam misalignment, were retained.
Conflict: Following the successful pilot, production management requested that ERP integration be completed before the full-scale PIB system went live, citing audit and payroll reconciliation risks from running a pay-linked incentive system outside the ERP. The IT team responded that development capacity was committed to other priorities and that full ERP-native integration within the project timeline was not feasible. The standoff risked blocking full-scale rollout indefinitely.
BA Action: The BA proposed a phased architecture that decoupled operational deployment from ERP timeline: deploy all 172 lines using the pilot-validated Google Sheets and Data Studio infrastructure; run one parallel PIB cycle cross-validated against the legacy manual process; then migrate to ERP as a separate workstream on IT's available schedule. This reframed ERP integration from a prerequisite to a parallel workstream.
All three conflicts shared a common structure: a technically valid objection from a stakeholder who was not wrong, but whose objection, if unresolved, would have blocked a system that was correct in its design intent. The BA's role in each case was not to override the objection but to engineer the specific change that made the objection no longer valid, then document that change formally so it could not be revisited informally later.
| Objective | Delivered | Measured Impact | Measurement Basis | Status |
|---|---|---|---|---|
| Improve average production line efficiency | IoT real-time visibility enabled faster supervisor intervention on underperforming lines; PIB system created direct operator motivation to sustain output against IE targets | Average line efficiency: +15% post-deployment across 172 lines | Production management reporting against IE-set baseline targets. Directional; not independently audited against pre-system historical records, which were manual and incomplete. | ACHIEVED |
| Real-time production visibility across all lines | IoT devices live on all 172 woven production lines; live dashboards tracking output, efficiency, and machine status per line in real time | Visibility latency: end-of-shift manual report → real-time live data | Baseline confirmed in P-01: no real-time visibility existed. Post: production management confirmed live dashboard as primary monitoring tool at go-live | ACHIEVED |
| Eliminate manual and delayed reporting | Automated IoT data capture replaced manual tally sheets across all 172 lines; shift-end reporting eliminated as primary data source for KPI calculation | Reporting lag: 3–6 hours post-shift → real-time automated capture | Production management self-reported; manual tally sheets formally retired at full-scale deployment go-live. Not independently audited. | ACHIEVED |
| Standardize operator performance measurement | Three-KPI framework (Efficiency, DHU, Target Achievement) applied consistently across all 172 lines and all operators using the same calculation logic and IoT data source | Operators under standardized KPI measurement: 0 → 172 lines full coverage | Baseline: no operator-level KPI measurement existed. Post: all operators scored on identical framework from first live PIB cycle | ACHIEVED |
| Reduce downtime through faster detection | Mobile alert and call notification system activated for machine breakdown events; supervisors notified within minutes of machine status flag rather than end-of-shift | Breakdown detection: end-of-shift → real-time alert within minutes of flag event | Production management self-reported. Specific downtime reduction % not independently measured; directional improvement confirmed by floor supervisors | ACHIEVED |
| Introduce transparent, data-driven PIB system | PIB calculation fully automated from IoT-measured operator KPI data; band structure applied consistently; no supervisor discretion in PIB amount, band assignment is system-generated | PIB disputes in first two live cycles: 0 (vs. informal disputes every cycle under manual system) | HR and production management self-reported. Prior manual incentive process involved negotiation every cycle; no formal dispute log existed for the baseline period | ACHIEVED |
| Enable data-driven workforce management | Live KPI dashboards used by supervisors to reassign operators across underperforming lines in real time; monthly operator performance data used by management to identify training needs and target skill gaps | Workforce decisions shifted from floor observation and supervisor judgment → IoT-measured individual performance data | Production management self-reported. Both use cases, operator reassignment and training identification, confirmed as active practices by supervisors and management post go-live | ACHIEVED |
The +15% average line efficiency gain is the primary quantified outcome. Across 172 lines, this represents a material increase in daily unit output without adding headcount, equipment, or shift hours — achieved through real-time visibility that accelerated supervisor response and a PIB structure that gave operators a direct financial stake in their output. In a woven manufacturing environment where 1–2% gains are operationally significant, a 15% improvement positions this as a business impact project, not a technology deployment.
Three decisions made during the design and pilot phases determined the long-term integrity of the system. Each addressed a specific failure mode, in measurement accuracy, incentive fairness, and framework governance, that would have undermined operator trust and management credibility if left unresolved.
The problem it solved: Including machine downtime in the efficiency denominator penalizes operators for events outside their control. A 30-minute fault on an 8-hour shift reduces efficiency by ~6 percentage points, enough to drop an operator one PIB band, through no action of their own. Without an exclusion rule, the PIB system would punish operators for maintenance failures while giving the maintenance team no accountability signal.
Decision: Machine downtime events flagged via IoT device or maintenance logging are automatically excluded from the efficiency calculation for the affected operator during that interval. Exclusion applies only to machine-caused events, not operator-initiated pauses or quality rework. All downtime flags are visible in the dashboard, so supervisors can verify they are not being used to mask low output.
The problem it solved: A 100% PIB eligibility threshold would have been unachievable on lines with frequent style changeovers. Pilot data showed that transitions took 45–90 minutes to stabilize, during which output was structurally below target regardless of operator skill. A 100% floor rewards line assignment, not operator performance.
Decision: Threshold set at 80% based on pilot data analysis, consistently achievable on well-managed lines under normal conditions, while meaningfully differentiating performers. Documented as a reviewable policy parameter subject to revision if IE-set targets change significantly.
The problem it solved: Deploying a pay-linked incentive system to 172 lines simultaneously without prior validation creates a single catastrophic failure mode: if the calculation is wrong, every operator's incentive is wrong at once. Correcting a payroll error across 172 lines post-payout is exponentially more damaging than correcting it on 8 lines before scale.
Decision: Mandatory 8-line pilot with specific validation gates before scale authorization. IoT device accuracy against manual counts, KPI logic against IE-validated records, operator input consistency across shifts, and PIB cross-check against legacy manual computation. All gates required to pass before deployment to the remaining 164 lines.
The system was deployed on the fastest feasible path to factory-wide operation. Two architectural limitations are known, acknowledged, and being addressed in the next development phase. Both were conscious decisions at the time they were made; they are documented here as open items, not oversights.
The limitation: KPI aggregation, PIB calculation, and dashboard visualization currently run on Google Sheets and Data Studio, the pilot infrastructure. This was the correct decision for rapid factory-wide scaling without waiting for ERP capacity, and the pilot had validated the calculation accuracy. However, two structural constraints grow more significant as the system matures: formula integrity in Sheets depends on access discipline rather than platform enforcement; and if an operator disputes their PIB, the system cannot reconstruct the exact data state at calculation time with ERP-grade immutability. Both are governance gaps that ERP migration will close.
The gap: The full system. IoT data ingestion, KPI calculation, PIB model, and dashboards, is planned for migration into the organization's ERP. Target state: IoT events captured directly into ERP, KPI scores computed within the enterprise data environment, PIB outputs feeding directly into payroll, eliminating the Sheets intermediary entirely. Until migration is complete, PIB calculation requires a manual export step from the IoT feed into Sheets each cycle. This is validated against raw event logs, but represents the only remaining manual integration point in an otherwise automated pipeline.
The BA role covered the full delivery lifecycle. This was not a hand-off engagement; sustained involvement was needed through pilot validation, full-scale deployment, and ERP integration coordination.
| Responsibility Area | Specific BA Deliverable | Phase | Outcome |
|---|---|---|---|
| Requirement Gathering | Stakeholder interview plan; structured pain-point documentation across production, IE, QA, and IT; baseline process map of manual reporting workflow | P-01 | Confirmed 4 root-cause gaps driving the project mandate; scoped system boundary before design started |
| KPI Framework Design | Three-KPI specification (Efficiency %, DHU, Target Achievement); PIB composite score model (Efficiency + Target Achievement); DHU deduction policy design; band structure definition; DHU operator-attribution classification framework | P-02 | Signed off by IE and production management before IoT device configuration; no mid-build redesign required |
| IoT System Specification | IoT device event schema; operator button interface data requirements; real-time data flow architecture document; downtime exclusion policy specification | P-03 | Provided the technical specification required by device configuration team; ensured data captured matched KPI calculation requirements |
| Process Mapping | End-to-end data flow map (device → feed → KPI engine → dashboard → PIB → payroll); operator workflow integration map; supervisor alert response workflow | P-03 – P-04 | Identified the shift overlap and dual-operator edge cases during mapping that were resolved before pilot launch |
| Pilot Execution & Validation | Pilot monitoring protocol; accuracy gate criteria; cross-validation against manual records; edge case log; pilot findings report for scale authorization | P-04 – P-05 | All accuracy gates passed; 2 edge cases identified and resolved; pilot report provided deployment authorization basis for management |
| Stakeholder Conflict Resolution | Facilitated operator trust sessions; IE–QA DHU classification working session; IT–production phased deployment proposal; all resolutions documented in specification | P-01 – P-06 | All three major conflicts resolved without scope reduction or system compromise; resolutions embedded as formal policy, not verbal agreements |
| Training & Change Management | Operator briefing materials (production floor language, translated where required); supervisor dashboard interpretation training; department head PIB review training; go-live readiness checklist | P-07 – P-08 | System adopted at full scale with zero BA dependency post-handover; no training-related call-backs in the first two live PIB cycles |
| ERP Integration Coordination | KPI data schema specification for IT handover; PIB calculation logic documentation; IoT event taxonomy for ERP field mapping; parallel-run cross-validation report | P-08 · Ongoing | IT team received complete specification for ERP development; parallel-run confirmed Sheets PIB output matches manual computation; migration in progress |
| Stakeholder | Role in Project | Primary Interest | Engagement Mode | Alignment Status |
|---|---|---|---|---|
| Production Management | Primary sponsor; final authority on KPI targets and PIB policy sign-off | Real-time line visibility; accurate PIB system; reduced supervisor reporting burden | Requirement interviews; KPI sign-off sessions; pilot review; scale authorization | ALIGNED |
| Industrial Engineering (IE) | Target-setting authority; technical validator of Efficiency % and Target Achievement logic | Technically defensible KPI calculation; correct target calibration; DHU attribution accuracy | KPI design working sessions; DHU classification workshop; pilot data review | ALIGNED after DHU conflict resolution |
| Quality Assurance | DHU data source; defect classification authority; quality alert threshold setting | DHU tracked at operator level; quality issues surfaced in real time; system reflects QA audit standards | DHU classification workshop with IE; alert threshold configuration review | ALIGNED |
| IT Department | ERP integration owner; infrastructure support for IoT data pipeline | Feasible development timeline; clear data schema for ERP build; no surprise scope additions | Architecture review sessions; ERP specification handover; phased deployment negotiation | ALIGNED after phased deployment resolution |
| HR Department | PIB policy co-owner; payroll reconciliation authority; training coordination support | Transparent, dispute-free incentive calculation; clear PIB documentation for payroll; operator fairness | PIB model review; parallel-run cross-validation; go-live sign-off | ALIGNED |
| Production Operators | Primary system users; IoT data source at point of production | Fairness in PIB calculation; protection from factors outside their control; understanding of how input affects income | Floor briefing sessions; downtime policy communication; PIB calculation demonstration using live data | ALIGNED after trust sessions and downtime exclusion policy |
| Line Supervisors | Dashboard primary users; alert responders; operator reassignment decision-makers; first-level PIB query handlers | Actionable real-time data per line; operator-level KPI visibility for reassignment decisions; clear alert thresholds; reduced manual reporting workload | Dashboard training; alert configuration review; reassignment workflow integration; go-live support period | ALIGNED |
The most complex alignment journey was the production operator group, the largest group and the only one without a formal meeting-room channel. Reaching them required floor-level sessions, visual PIB demonstrations using their own data, and a system change that proved intent through action. No amount of documentation substitutes for showing an operator their own numbers and explaining exactly how those numbers become their paycheck.
Risks were identified in P-01 and tracked throughout. Two of the five materialized during delivery. Both are documented with the BA action taken and current resolution status.
| Risk | Category | Likelihood · Impact | BA Mitigation | Outcome |
|---|---|---|---|---|
| Operator non-adoption of IoT input buttons, deliberate under-reporting or inconsistent use | People · Change | High · Critical | Operator trust sessions; downtime exclusion policy designed and implemented; PIB benefit demonstration using pilot data; translated briefing materials | MATERIALIZED · RESOLVED — Under-reporting was observed in pilot weeks 1–2. Resolved through trust sessions and downtime policy change. Accuracy normalized by pilot week 3. |
| KPI calculation error at scale, incorrect PIB output affecting operator pay | Technical · Data | Medium · Critical | Pilot-first deployment mandate; accuracy gates against manual records; parallel-run cross-validation before ERP migration; edge case documentation | MITIGATED — Pilot identified shift overlap and dual-operator edge cases before scale. Cross-validation confirmed calculation accuracy. No PIB errors in first two live cycles. |
| IoT device reliability failure, hardware downtime on production lines disrupting data capture | Technical · Infrastructure | Medium · High | Device uptime tracked as explicit pilot gate metric; maintenance response protocol defined; downtime exclusion policy protects operators during device failure periods | MITIGATED — Device uptime met the pilot reliability threshold. Downtime exclusion policy covers device failure events as well as machine breakdowns. No systemic device failure observed at full scale. |
| Stakeholder rejection of DHU as a PIB component. IE objection blocking quality-linked incentive | Stakeholder · Scope | Medium · High | IE–QA joint classification workshop; operator-attributable defect taxonomy developed; DHU logic documented with IE sign-off before go-live | MATERIALIZED · RESOLVED — IE formally objected during P-02. Resolved through IE–QA classification framework. DHU retained as a proportional deduction parameter applied after PIB band assignment, scoped to operator-attributable defect categories only. IE sign-off obtained. |
| ERP integration delay blocking full-scale PIB go-live. IT capacity constraint | Delivery · Dependencies | High · Medium | Phased deployment architecture designed to decouple scale deployment from ERP timeline; Google Sheets PIB validated as interim platform; parallel-run protocol established | MITIGATED — IT confirmed ERP development capacity was unavailable for the deployment window. Phased deployment proposal accepted by production management. Scale deployment proceeded on time; ERP migration ongoing as separate workstream. |
Assumptions were documented at initiation and shared with stakeholders as conditions the project plan relied on. Each has been validated or flagged at closure. Where an assumption proved wrong, the impact and resolution are recorded.
| Assumption | Owner | Validation Status | Impact if Incorrect |
|---|---|---|---|
| IE-set production targets are stable across the pilot period and will not be revised during the 8-line validation phase | IE Team | VALIDATED — Targets remained stable during pilot. IE committed to a target-freeze period for the pilot duration at P-01. | Mid-pilot target revision would have invalidated the efficiency and Target Achievement baseline comparisons used for PIB threshold-setting |
| Operators will be available for briefing sessions during production hours without significant line disruption | Production Management | VALIDATED — Sessions were scheduled in staggered groups during shift transition periods with production management coordination. No line disruption reported. | Delayed or inaccessible operator sessions would have extended the trust-building period and risked under-reporting persisting into the full-scale deployment |
| IT will provide ERP data schema support within 4 weeks of the KPI specification handover | IT Department | PARTIALLY INVALIDATED — ERP schema review took longer than 4 weeks due to competing IT priorities. Did not affect deployment timeline due to phased architecture decision, but extended the split-platform period. | Phased deployment architecture absorbed the delay. Without the phased approach, this assumption failure would have blocked the full-scale go-live. |
| QA audit defect records are consistent enough across auditors to serve as a reliable DHU secondary validation source | Quality Assurance | VALIDATED — QA confirmed consistent audit coding methodology across all floor auditors. IoT-logged DHU correlated within acceptable variance against QA audit records during pilot cross-check. | Inconsistent QA records would have undermined the DHU calculation's credibility and revived the IE team's objection to its inclusion in PIB |
| HR will co-own the PIB band structure and sign off before the first live incentive cycle | HR Department | VALIDATED — HR reviewed the PIB band structure, parallel-run results, and incentive calculation logic before the first live PIB cycle was processed. Formal sign-off obtained and documented. | Without HR sign-off, the PIB system would have lacked the authority required to replace the manual incentive process, which would have left the system as a parallel record rather than the governing payroll input |
- Budget constraint: No ERP development budget was allocated for the initial deployment phase. All first-generation measurement and calculation infrastructure was required to operate within existing tool access (Google Workspace). This constraint drove the phased architecture decision and is the root cause of Gap 01 and Gap 02 documented in §4.
- Timeline constraint: Full-scale deployment was required before the next monthly PIB calculation cycle. This created a fixed deadline for pilot validation, scale rollout, and operator training, leaving no slack for rework if the pilot had identified a fundamental KPI design flaw rather than edge case issues.
- Language and literacy constraint: Operator briefing materials and IoT device interfaces needed to be accessible to operators with varying literacy levels across multiple languages. All materials were reviewed for simplicity and translated where required before pilot deployment.
- IT development capacity constraint: ERP development resource was shared across multiple concurrent organizational projects. The BA had no authority over IT prioritization, which made the phased deployment architecture a design necessity rather than a preference.
- Physical access constraint: IoT device installation required production line downtime for mounting and calibration. All installations were scheduled during non-production hours and shift changeovers to avoid output loss during deployment.