Command Center
| Version | Date | Author | Reviewed By | Status | Change Description |
|---|---|---|---|---|---|
| v0.1 | Draft | Tonmoy Paul | — | DRAFT | Initial structure. Executive summary, problem statement, objectives drafted. |
| v0.2 | Draft | Tonmoy Paul | IE Lead | DRAFT | KPI definitions added. IE-QA efficiency definition conflict identified and escalated. Stakeholder register completed. |
| v0.3 | Draft | Tonmoy Paul | IE Lead · QA Manager | REVIEW | KPI definitions signed off. Functional requirements finalized. Alert thresholds agreed with Operations Management. Scope confirmed. |
| v1.0 | Final | Tonmoy Paul | Factory Management | APPROVED | Full document finalized. Dashboard build completed and validated. Benefits measured and recorded. RTM completed. |
This document covers the business requirements, analytical approach, solution design, and outcomes for the Manufacturing Command Center (MCC): a real-time operational intelligence system built to replace fragmented spreadsheet reporting across a 16-line garment manufacturing environment.
The MCC was built on a structurally realistic simulated dataset using the same KPI logic, alert design, and dashboard architecture as the live environment. The documentation covers the full BA and BI engineering lifecycle: elicitation, stakeholder alignment, KPI framework design, data modelling, dashboard build, and benefits measurement.
The system replaced a multi-team, multi-spreadsheet reporting model with a single source of truth, enabling real-time visibility into production efficiency, quality performance, downtime, and operational risk across all 16 lines simultaneously.
The organization is a large, vertically integrated garment manufacturer supplying multiple international buyers, one of which runs a structured factory performance audit programme. Operations span multiple production floors, each running 16 or more sewing lines, with separate cutting, quality, and IE functions reporting to factory management.
- 16 active sewing production lines
- Continuous daily operations
- 100K+ simulated production records
- Multiple international buyer programmes
- Industrial Engineering (IE)
- Quality Assurance (QA)
- Production Management
- Operations & Factory Leadership
- $978,017 total inefficiency cost detected in dataset
- Cost-per-efficiency-point quantified per line
- Buyer SLA performance tracked and flagged
- Cost effect of not achieving planned efficiency quantified per line
Two pressures made the existing setup unworkable. Factory leadership was making production decisions on data 5 to 7 hours old; by then, the losses had already happened. And there was no way to detect a deteriorating line in real time, connect a quality spike to its cause, or rank all 16 lines by any dimension without manually pulling from multiple spreadsheets. The problem was not data collection. Raw data existed across IE, QA, and Production records. What was missing was an intelligence layer: something that could identify what mattered, classify how serious it was, and get it to the right person before the window to act had closed.
The strategic case for the MCC was not reporting efficiency, it was decision quality. Every hour of lag between an operational event and management awareness was an hour in which correctable losses compounded. The system was designed to eliminate that lag, not just reduce it.
Before the MCC, reporting ran through a collection of department-owned spreadsheets with no shared definitions and no real-time access. Factory leadership made operational decisions from manually compiled reports that arrived hours after the relevant events.
ROOT CAUSE SUMMARY: Reporting was structurally reactive. By the time data was compiled, validated, and shared, the operational window to intervene had already closed.
(4–8 hr lag)
(separate from IE)
delayed written update
Management
(conflicting metrics)
(1–2 hrs per session)
(production already affected)
| Function | Daily Manual Reporting Time | Reporting Lag | Key Failure Point |
|---|---|---|---|
| IE Team | ~90 min/day (data compilation + calculation) | 4–6 hours after data entry | SMV-based efficiency not reconciled with QA figures |
| QA Team | ~60 min/day (defect logging + summary) | 4–8 hours after data entry | No real-time DHU tracking; alert only after manual review |
| Production Supervisors | ~30–45 min/day per supervisor (×16 lines) | End of day or next morning | Downtime causes logged inconsistently or missed entirely |
| Factory Management | ~60–90 min/day (reconciling 3 separate reports) | Decision made on prior-period data | No single trusted figure — 8–12% efficiency variance between departments |
| Total (estimated) | ~3.5–5 hrs/day across functions | Avg. 5–7 hours from event to management awareness | $978,017 total inefficiency cost detected in dataset |
| # | Pain Point | Business Impact | Severity |
|---|---|---|---|
| PP-01 | No single source of truth for manufacturing performance | Conflicting data across departments eroded leadership confidence | Critical |
| PP-02 | Fragmented spreadsheet reporting across IE, QA, and Production | Reconciliation overhead; inconsistent metric definitions | Critical |
| PP-03 | Reporting lag of hours to days for production & quality data | Decisions made on stale data; reactive rather than proactive management | Critical |
| PP-04 | No standardized KPI definitions across departments | IE and QA tracked "efficiency" differently, cross-team comparison was impossible | High |
| PP-05 | No centralized alert or escalation mechanism | Operational risks surfaced through informal channels; escalation was inconsistent | High |
| PP-06 | Limited trend visibility and root cause analysis capability | Performance patterns went undetected until variances became losses | High |
| PP-07 | Manual reporting consumed significant IE and supervisor time daily | Value-add analysis capacity displaced by data compilation activity | Medium |
- Underperforming lines operated for full shifts before identification
- Quality defects compounded between detection and correction
- Downtime root causes logged inconsistently or not at all
- Efficiency baselines varied by 8–12% depending on who compiled them
- No capacity to rank lines by performance for shift prioritization
- External buyer audit readiness required manual retroactive reconstruction
| Stakeholder | Role / Function | Interest | Influence | Engagement Mode |
|---|---|---|---|---|
| Factory Management | Executive oversight | Real-time production & cost visibility; executive KPI summary | High | Dashboard consumer · Sign-off authority |
| IE Team | Industrial Engineering | OWE, efficiency, line balancing, and productivity metrics | High | Primary requirement source · KPI definition owner |
| Quality Assurance | QA / QC Management | DHU, FPY, defect category tracking, rework monitoring | High | Requirement source · Data validator |
| Production Managers | Line-level operations | Output vs. target, downtime causes, WIP status, line rankings | Medium | Operational user · Feedback provider |
| Operations Leadership | Cross-floor coordination | Aggregate performance across shifts and sections; risk alerts | High | Dashboard consumer · Escalation receiver |
| Lead International Buyer (External) | Buyer / Audit Programme | OWE & QCO compliance; audit-ready KPI documentation | High | Indirect, buyer audit framework shaped quality requirements |
Requirement sessions with production management surfaced a critical structural conflict: IE and QA tracked "efficiency" using different denominators. IE used SMV-based calculations while QA applied output-per-operator ratios, producing figures 8–12% apart from the same underlying data. Resolving this required facilitated cross-functional sessions, not just technical alignment. KPI definitions were signed off by both IE and QA leads before the data model was built. Without this step, every downstream dashboard figure would have been contested.
Conflict: IE calculated production efficiency using SMV (Standard Minute Value) — Earned Minutes ÷ Available Minutes. QA used an output-per-operator ratio. Applied to identical shift data, the two methods produced figures 8–12% apart. Both teams reported their figure as "efficiency" — making cross-department comparison structurally impossible and leadership reporting unreliable.
BA Action: Facilitated a joint IE–QA session. Presented both formulas side-by-side with the same sample data to demonstrate the divergence. Documented both approaches in the draft KPI register and requested written sign-off on a single agreed formula before proceeding with data model build.
Conflict: No prior operational standard existed for when a KPI deviation formed an "alert." IE proposed efficiency thresholds based on SMV targets; Operations Management had informal expectations that differed. Without agreement, alert thresholds would either under-fire (missing real issues) or over-fire (creating alert fatigue).
BA Action: Facilitated a dedicated threshold-setting session with IE Lead, QA Manager, and Operations Leadership. Used historical data distributions (from simulated dataset) to show the frequency of breaches at different threshold levels, making the tradeoff between sensitivity and false positives concrete and data-driven.
| Deliverable | BA (Tonmoy) | IE Lead | QA Manager | Production Mgmt | Factory Leadership |
|---|---|---|---|---|---|
| Requirement Elicitation | R · A | C | C | C | I |
| KPI Definition & Sign-Off | R · A | A · C | A · C | C | I |
| Data Model Build | R · A | C | C | I | I |
| Dashboard Design & Build | R · A | C | C | C | I |
| Alert Threshold Definition | R · A | C | C | A · C | I |
| UAT & Validation | R · A | A · C | A · C | C | I |
| Final Approval & Sign-Off | I | C | C | C | R · A |
| Dashboard Maintenance | R · A | I | I | I | I |
- Eliminate fragmented, multi-spreadsheet reporting by creating a single, authoritative source of manufacturing performance data
- Implement a threshold-based automated alert system to surface operational risks before they become production losses, eliminating the need for manual KPI monitoring across 16 lines
- Deploy an automated intelligence layer that classifies trends, aggregates root causes, ranks lines, and computes risk scores on every data entry, replacing hours of manual analytical work with instant, always-current insight
- Enable real-time monitoring of production, quality, and operational KPIs across all 16 production lines
- Standardize KPI definitions and calculation logic, accepted and enforced across IE, QA, and Production functions
- Automate KPI calculations to reduce daily manual reporting effort by ≥70%
- 16 simulated production lines (structurally mirroring live deployment)
- Production KPIs: efficiency, output, target achievement, WIP, productivity
- Quality KPIs: DHU, FPY, reject rate, rework rate, defect categories
- Downtime KPIs: total downtime, downtime causes, availability rate
- Operational risk scoring and alert logic
- Line performance ranking and trend monitoring
- Executive-level and operational-level dashboard views
- 6 interactive Google Data Studio report pages
- Live ERP data integration (simulated dataset used)
- Cutting section and sample section (separate projects)
- Cost accounting and financial P&L reporting
- HR and attendance systems
- Buyer portal or external reporting interfaces
- Mobile app deployment
- Automated data ingestion pipelines (manual data entry model)
| Category | Detail |
|---|---|
| Data Source | Simulated dataset structured to reflect real production variability; live data is confidential |
| Toolchain | Google Sheets (data model & calculation layer) + Google Data Studio (visualization layer) — zero additional software cost |
| Users | Dashboard consumers are management-level; no operator-facing interface required |
| Refresh Cadence | Near-real-time (data entered per shift; dashboards update on trigger) |
| KPI Ownership | IE team owns efficiency and productivity definitions; QA owns quality metric definitions |
The following risks were identified during elicitation and design. Each is assessed by probability and impact with the mitigation strategy applied or planned. The register was tracked actively throughout the project, not filed after P-01.
Risk R-01 (KPI definition dispute) was the highest-consequence risk identified during elicitation, it threatened the entire analytical foundation of the system. Resolving it through facilitated stakeholder sessions before touching the data model was the single most important BA decision made in this project.
Requirements are MoSCoW-prioritized, each with an ID, description, and acceptance criteria used to validate the solution.
The system must consolidate production, quality, and operational data from all 16 lines into a single, structured data model in Google Sheets, serving as the authoritative source for all downstream dashboard calculations.
- All 16 lines represented in a single, normalized data structure
- No duplicated calculation logic across sheets, single formula layer
- Data model passes cross-functional validation with IE and QA sign-off
All KPI calculations must use definitions agreed in writing by IE and QA stakeholders. Calculation logic must be documented, version-controlled, and consistent across all 16 lines without exception.
- KPI definition register signed off by IE Lead and QA Manager
- Same formula applied to identical inputs returns same output across any two lines
- Efficiency variance between IE and QA interpretations eliminated
The system must deliver six interactive dashboard pages covering: factory overview, production performance, quality performance, operations performance, line performance analysis, and operational alerts, accessible to management without requiring data expertise.
- All 6 dashboard pages functional and displaying live-calculated data
- Executive summary visible on factory overview without drill-down
- Line-level filtering accessible on production and quality pages
The system must automatically evaluate all KPI values against configured thresholds on every data entry, without requiring any manual check or dashboard review. When a threshold is breached, the system must generate an alert record containing: the affected line, the KPI in breach, the deviation magnitude, the severity classification (Critical / Warning / Watch), and the required escalation path. All active alerts must be surfaced in a dedicated Operational Alert Center dashboard, visible to authorized users without any filtering or manual compilation.
- Alerts fire automatically within one calculation cycle (<3 seconds) of threshold-breaching data being entered
- All 6 alert types active: efficiency, output target, DHU quality, downtime, reject rate, and composite risk score
- Severity levels (Critical / Warning / Watch) applied consistently per documented trigger logic
- Alert Center shows: line identity, KPI affected, deviation magnitude, severity, and escalation path, without any manual input
- Thresholds stored in configuration sheet, adjustable by authorized users without formula changes
- Alert logic validated against edge cases: simultaneous multi-line breaches, recovery from breach, boundary condition behavior
Beyond threshold alerts, the system must automatically generate operational insights from the computed KPI data, without requiring analyst intervention. This includes: trend direction classification per line, downtime root cause aggregation by category, defect pattern analysis by type, line performance ranking across all 16 lines, and composite risk score computation. All insights must update automatically on every data entry and be visible on the relevant dashboard page without any manual step.
- Rolling efficiency trend calculated per line; trend direction (improving / stable / declining) auto-classified on each refresh
- Downtime auto-aggregated by cause category (mechanical, material, process, personnel) — no manual categorization by management required
- Defect dominant category auto-identified per line; displayed on Quality Performance Center without analyst compilation
- All 16 lines ranked automatically by any KPI; ranking updates on every data entry
- Composite Operational Risk Score computed per line from weighted multi-KPI deviation; single-number output per line
- Quality risk trajectory (DHU proximity to buyer threshold) calculated and displayed without manual calculation
The system should enable management to rank all 16 production lines by any monitored KPI, identifying top performers, underperformers, and variance drivers across shifts and time periods.
- Line Performance Analyzer page displays sortable ranking by efficiency, output, DHU, and downtime
- Visual differentiation between top-quartile and bottom-quartile lines
- Trend comparison available for any line over rolling time window
The system should surface trend lines, variance patterns, and root cause indicators across production, quality, and downtime dimensions, enabling proactive rather than reactive operational decisions.
- Trend charts displayed for efficiency, DHU, and downtime over time
- Downtime cause breakdown visible at line and floor level
- Defect category analysis available on quality performance page
The system could calculate a composite risk score per line, aggregating KPI deviations across production, quality, and downtime dimensions, enabling management to prioritize attention across all 16 lines in a single view.
- Risk score calculated and displayed per line on Operations Performance page
- Score logic documented and validated against real-world escalation scenarios
- High-risk lines visually differentiated in dashboard layout
User stories frame each functional requirement as the decision it enables. Format: As a [role], I need [capability] so that [business outcome]. Each story links back to its parent requirement.
| ID | User Story | Priority | Parent FR |
|---|---|---|---|
| US-01 | As a Factory Manager, I need a single-page factory overview dashboard so that I can assess overall production health in under 10 seconds at the start of any shift, without opening multiple spreadsheets. | MUST | FR-01, FR-03 |
| US-02 | As a Production Manager, I need to rank all 16 lines by efficiency and output variance so that I can prioritize supervisory attention to underperforming lines within the first 30 minutes of a shift. | MUST | FR-03, FR-05 |
| US-03 | As a QA Manager, I need real-time DHU and FPY tracking per line so that I can identify quality deterioration before it reaches buyer rejection thresholds, enabling corrective action within the same shift. | MUST | FR-02, FR-03, FR-04 |
| US-04 | As an IE Supervisor, I need KPI calculations using agreed SMV-based efficiency formulas so that the figures I report to management are never disputed by QA or Production using different denominators. | MUST | FR-02 |
| US-05 | As an Operations Lead, I need automated alerts when any KPI breaches its threshold so that I am notified of operational risks without having to monitor 16 lines manually throughout the shift. | MUST | FR-04 |
| US-06 | As a Production Manager, I need downtime tracked by cause category so that I can distinguish between mechanical failures, material shortages, and process issues, and escalate to the right team immediately. | SHOULD | FR-03, FR-06 |
| US-07 | As a Factory Manager, I need a single composite risk score per line so that when I have 2 minutes before a management meeting, I know exactly which three lines need my attention, without reading 16 individual KPI summaries. | SHOULD | FR-07 |
| US-08 | As an IE Analyst, I need trend charts showing rolling efficiency per line so that I can distinguish a one-shift anomaly from a structural performance decline requiring a line balancing intervention. | SHOULD | FR-06 |
| US-09 | As a QA Supervisor, I need defect category breakdown per line so that I can identify whether quality issues are operator-skill-driven or process/material-driven, enabling targeted corrective actions. | SHOULD | FR-03, FR-06 |
| US-10 | As Factory Leadership, I need buyer-audit-aligned quality data in a standardized, auditable format so that QCO compliance reporting does not require manual retroactive data reconstruction before each audit. | COULD | FR-01, FR-02 |
Non-functional requirements define the quality attributes the system must meet, independent of specific features. These were agreed with operations management and define what done means beyond functional delivery.
All Google Data Studio dashboard pages must load within 5 seconds on a standard office internet connection. KPI calculations in the Google Sheets data model must update within 3 seconds of new data entry. Latency beyond this makes real-time shift monitoring operationally unusable.
- All 6 dashboard pages load in ≤5 seconds on standard broadband
- Sheets calculation layer recalculates within 3 seconds of data entry
- No circular reference errors or calculation bottlenecks present
The system must be accessible and functional during all production shift hours (typically 07:00–22:00 daily). Downtime outside of Google's SLA (≥99.9% uptime) is acceptable. Planned maintenance must not occur during shift hours.
- System accessible via any browser during all shift hours without login barriers for authorized users
- No scheduled maintenance windows during 07:00–22:00 operational hours
- Google Workspace SLA (99.9% uptime) accepted as the platform availability baseline
Management-level dashboard users must be able to read and interpret any dashboard page without training, documentation, or BA support. All KPI labels, status indicators, and alert classifications must be self-explanatory within the dashboard UI itself.
- 3 management-level users able to navigate and interpret all 6 pages without assistance in UAT session
- All status indicators (red/amber/green) accompanied by threshold labels, no interpretation required
- Alert Center readable without reference to any external documentation
All KPI outputs must be mathematically accurate against the agreed definitions in the KPI register. The data model must include input validation to prevent data entry errors from propagating into dashboard KPIs silently. Any calculation error must surface visibly, not produce a silent incorrect result.
- KPI outputs validated against manually calculated expected values for 20 test records — 100% match required
- Input validation rules applied to all data entry fields (range checks, data type enforcement)
- Error values (#DIV/0!, #REF!, etc.) trapped and replaced with meaningful indicators, not displayed raw
- Formula audit trail documented, any formula can be traced to its KPI definition register entry
The data model and dashboard must be structured so that a non-technical IE or QA team member can update alert thresholds, add a new production line, or adjust KPI targets without requiring BA or IT involvement for routine changes.
- Threshold values stored in a dedicated, clearly labelled configuration sheet, not hardcoded in formulas
- Adding a new production line requires changes in ≤3 locations, all documented
- A handover document covering routine maintenance tasks is delivered alongside the system
The underlying Google Sheets data model must be accessible only to authorized users. Dashboard consumers (management) should have view-only access to Google Data Studio reports, they must not be able to modify source data or formula logic.
- Google Sheets shared with edit access only to BA and designated IE data entry users
- Google Data Studio reports shared with view-only access for management consumers
- No public sharing links, access requires organizational Google account authentication
The KPI framework was built from scratch, not adapted from existing reports. Each indicator was selected because it could be measured from available data, was relevant to management decisions, and aligned with international buyer audit requirements. All 15+ KPIs cover three performance dimensions.
| Dimension | KPI | Formula / Logic | Decision Use |
|---|---|---|---|
| Production | Production Efficiency | (Earned Minutes / Available Minutes) × 100 | Primary line health indicator; target ≥85% |
| Output vs. Target | (Actual Output / Target Output) × 100 | Shift goal attainment; drives supervisory intervention | |
| Productivity (Pcs/Man-Hour) | Output ÷ (Operators × Hours Worked) | Labour utilization comparison across lines | |
| WIP Monitoring | Units in pipeline at each stage | Bottleneck identification; balance loss detection | |
| Production Variance | Actual Output − Target Output (units) | Absolute gap sizing for resource prioritization | |
| Quality | DHU (Defects per Hundred Units) | (Total Defects ÷ Total Inspected) × 100 | Primary quality health indicator; target ≤ buyer threshold |
| FPY (First Pass Yield) | (Units Passed First Inspection ÷ Total Inspected) × 100 | Rework-free throughput; cost of quality proxy | |
| Reject Rate | (Rejected Units ÷ Total Inspected) × 100 | Escalation trigger when buyer threshold approached | |
| Rework Rate | (Reworked Units ÷ Total Produced) × 100 | Hidden labour cost indicator; operator skill gap signal | |
| Operations | Downtime (Minutes/Line/Shift) | Sum of logged stop events by cause category | Availability loss quantification; maintenance trigger |
| Capacity Utilization | (Produced Units ÷ Theoretical Capacity) × 100 | Line loading efficiency; planning alignment | |
| Operational Risk Score | Weighted composite of deviation levels across all KPIs | Single number per line for management triage | |
| Alert Severity Count | Count of active alerts by severity (Critical / Warning / Watch) | Factory-wide risk state at a glance |
KPI design principle applied throughout: every indicator must answer a specific management question. "What is happening?" (factory overview), "Where is it happening?" (line analyzer), "How bad is it?" (alert center), "Why is it happening?" (trend analytics).
Data Layer (Google Sheets): Structured input sheets capture operational data per line per shift. A separate calculation layer applies the KPI framework, keeping raw inputs distinct from computed metrics. All formula logic is documented in a KPI definition sheet, the single reference point for any calculation dispute.
Visualization Layer (Google Data Studio): Six dashboard pages connect directly to the Sheets data model. Each page targets a specific audience and decision context, from executive overview to line-level analysis. Interactive filters let management cut by line, date, and shift without touching the data.
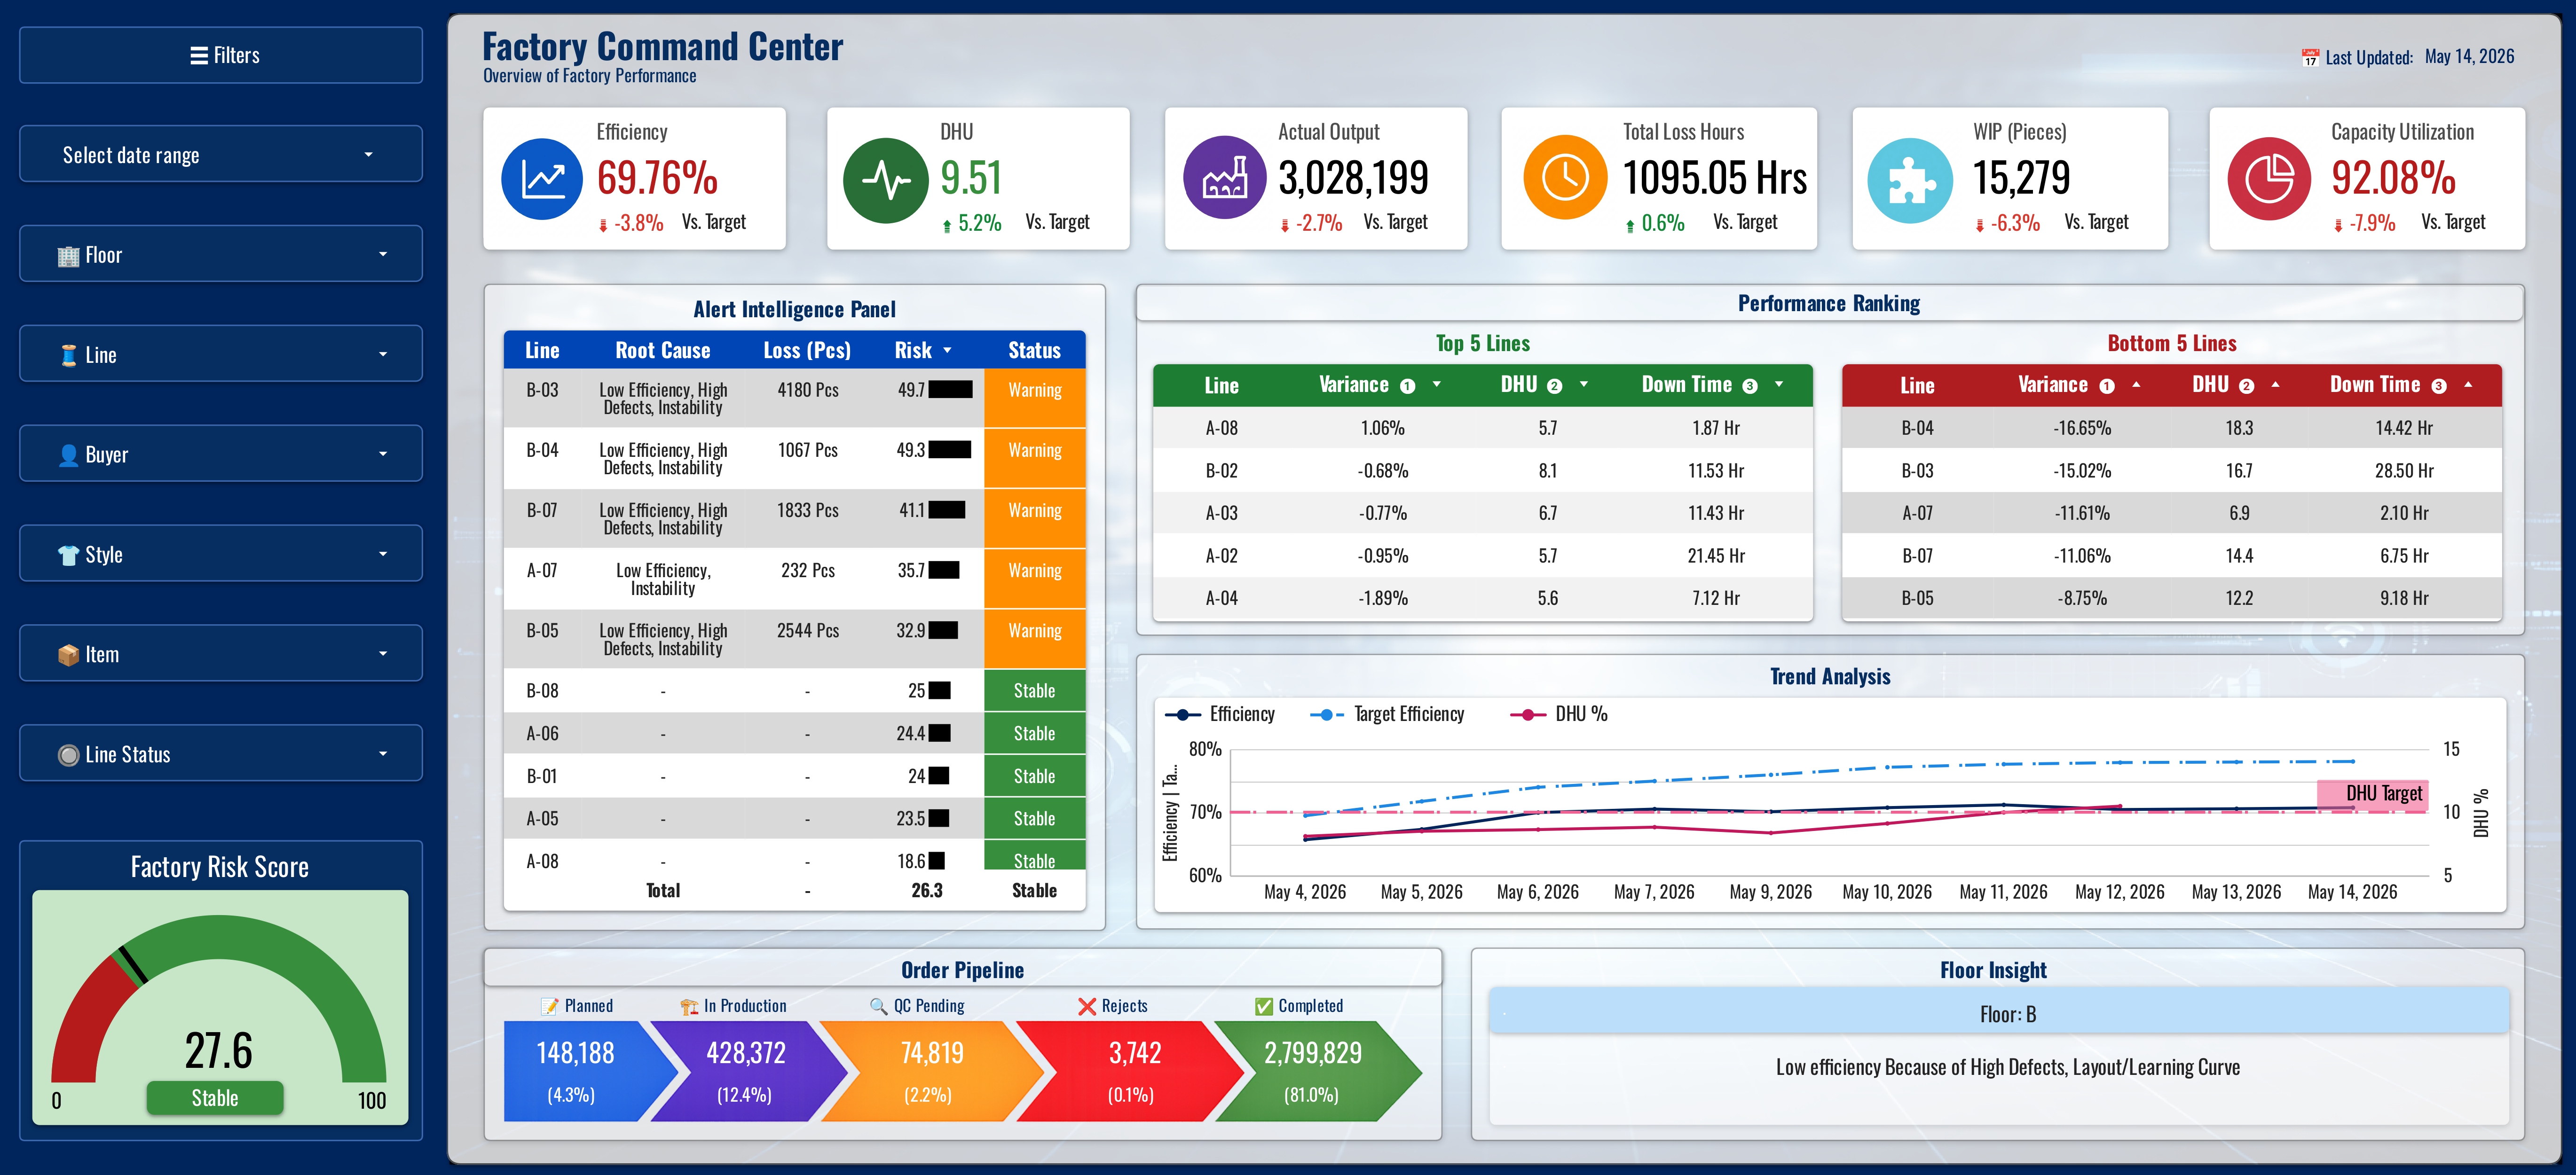
Purpose: The top-level executive view. This page answers the single most important question factory leadership asks at the start of every shift: "How is the factory performing right now?" It aggregates performance across all 16 lines into headline KPI scorecards, production efficiency, output vs. target, quality status, active alert count, and operational risk level, without requiring any drill-down. Design principle: any management-level user should be able to assess factory health in under 10 seconds. Red/amber/green status indicators are calculated automatically against defined thresholds, not set manually.
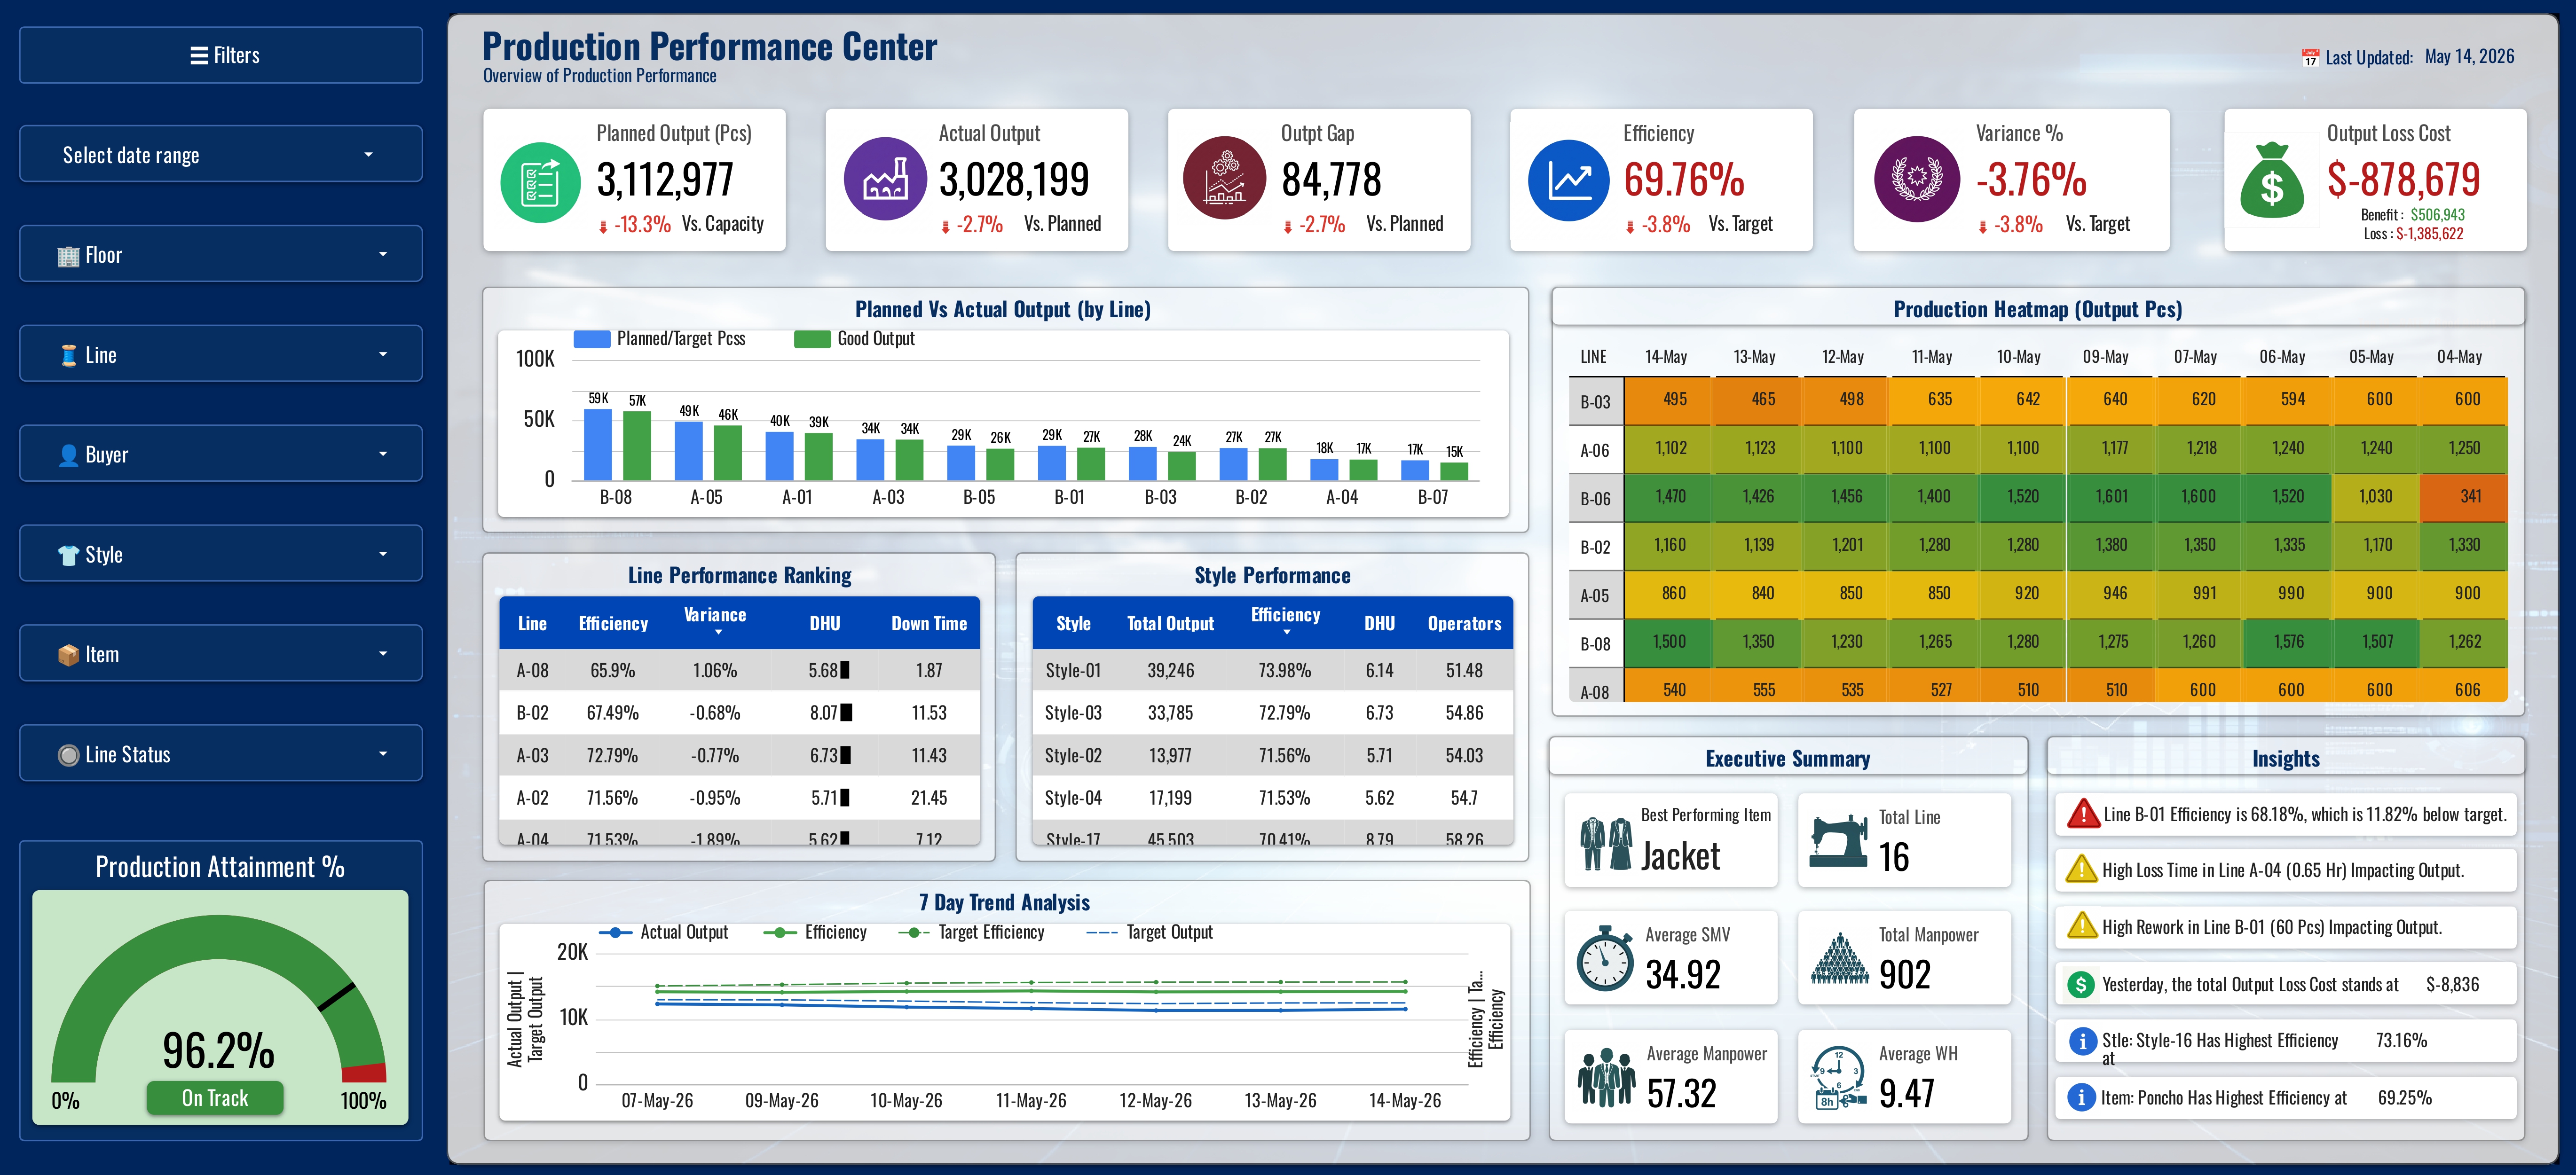
Purpose: The operational production view used by production managers and IE supervisors. Tracks efficiency, output achievement, productivity (pcs/man-hour), WIP status, and production variance per line. Interactive line filter enables management to isolate any of the 16 lines for detailed review. Key BA decision: IE and QA were tracking "efficiency" using different calculation bases, this page locks efficiency to the agreed SMV-based formula, eliminating the cross-department variance that had previously undermined reporting credibility. Trend charts display rolling efficiency per line, enabling trajectory analysis rather than single-point snapshots.
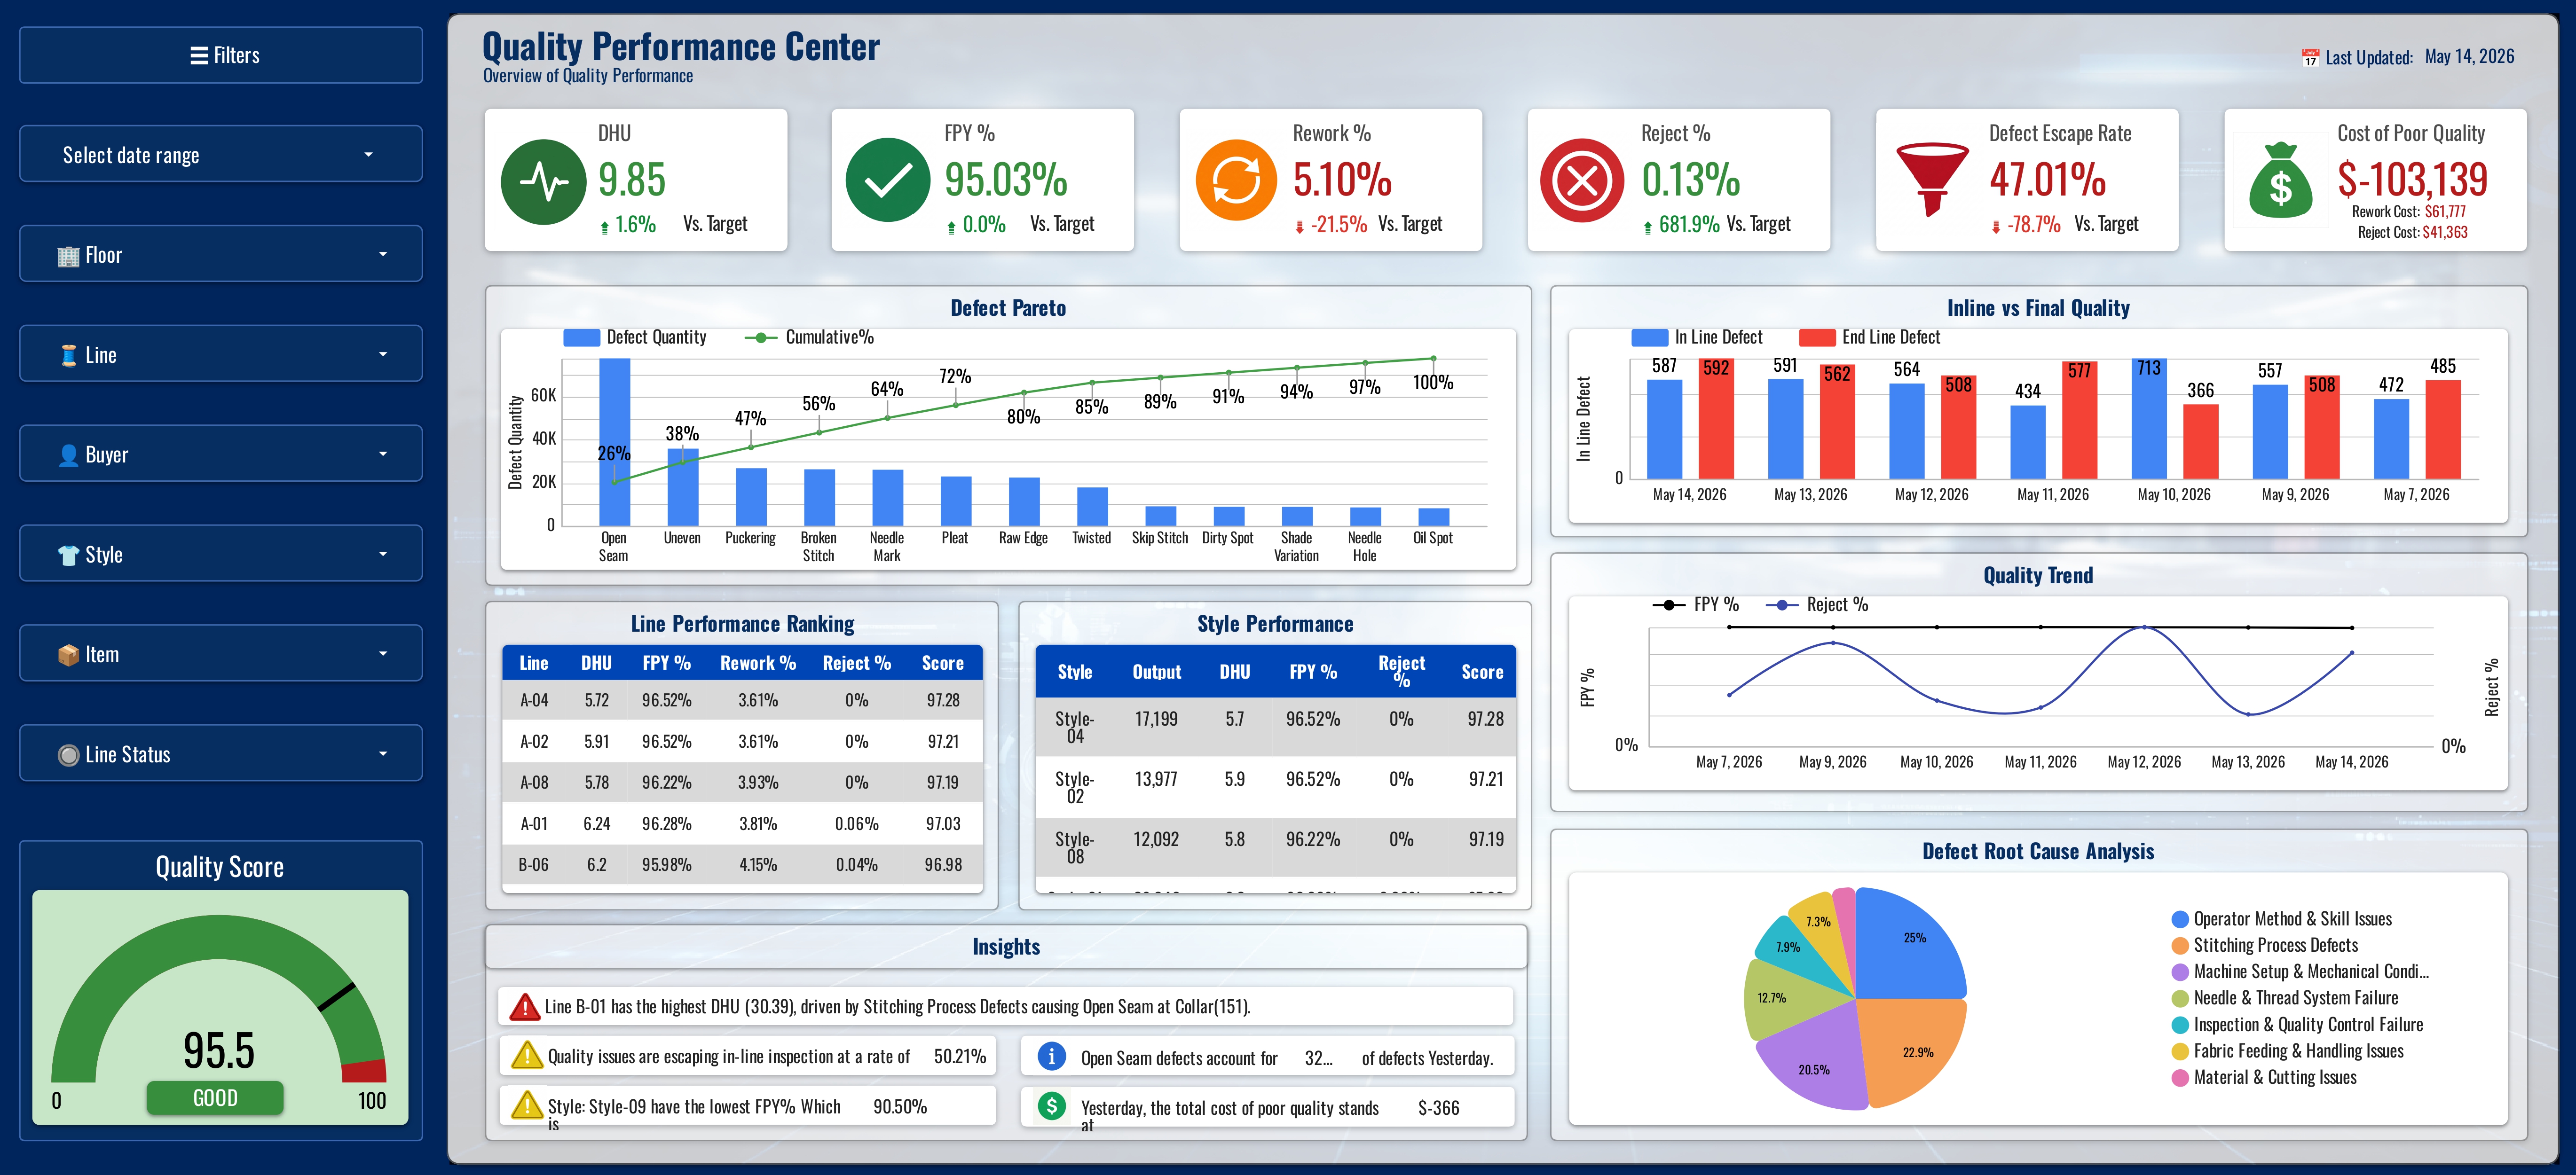
Purpose: The primary quality management interface for QA and production leadership. Surfaces DHU (Defects per Hundred Units), First Pass Yield, reject rate, and rework rate by line and by period. Defect category breakdown enables root cause analysis at the operation level, which defect types are driving DHU on which lines. Critical for buyer audit compliance: QCO (Quality Control Outcome) standards require consistent, auditable quality data. This page provides the structured, standardized quality reporting that replaces the previously fragmented QA spreadsheets. Alert indicators fire automatically when any line's DHU approaches the buyer threshold.
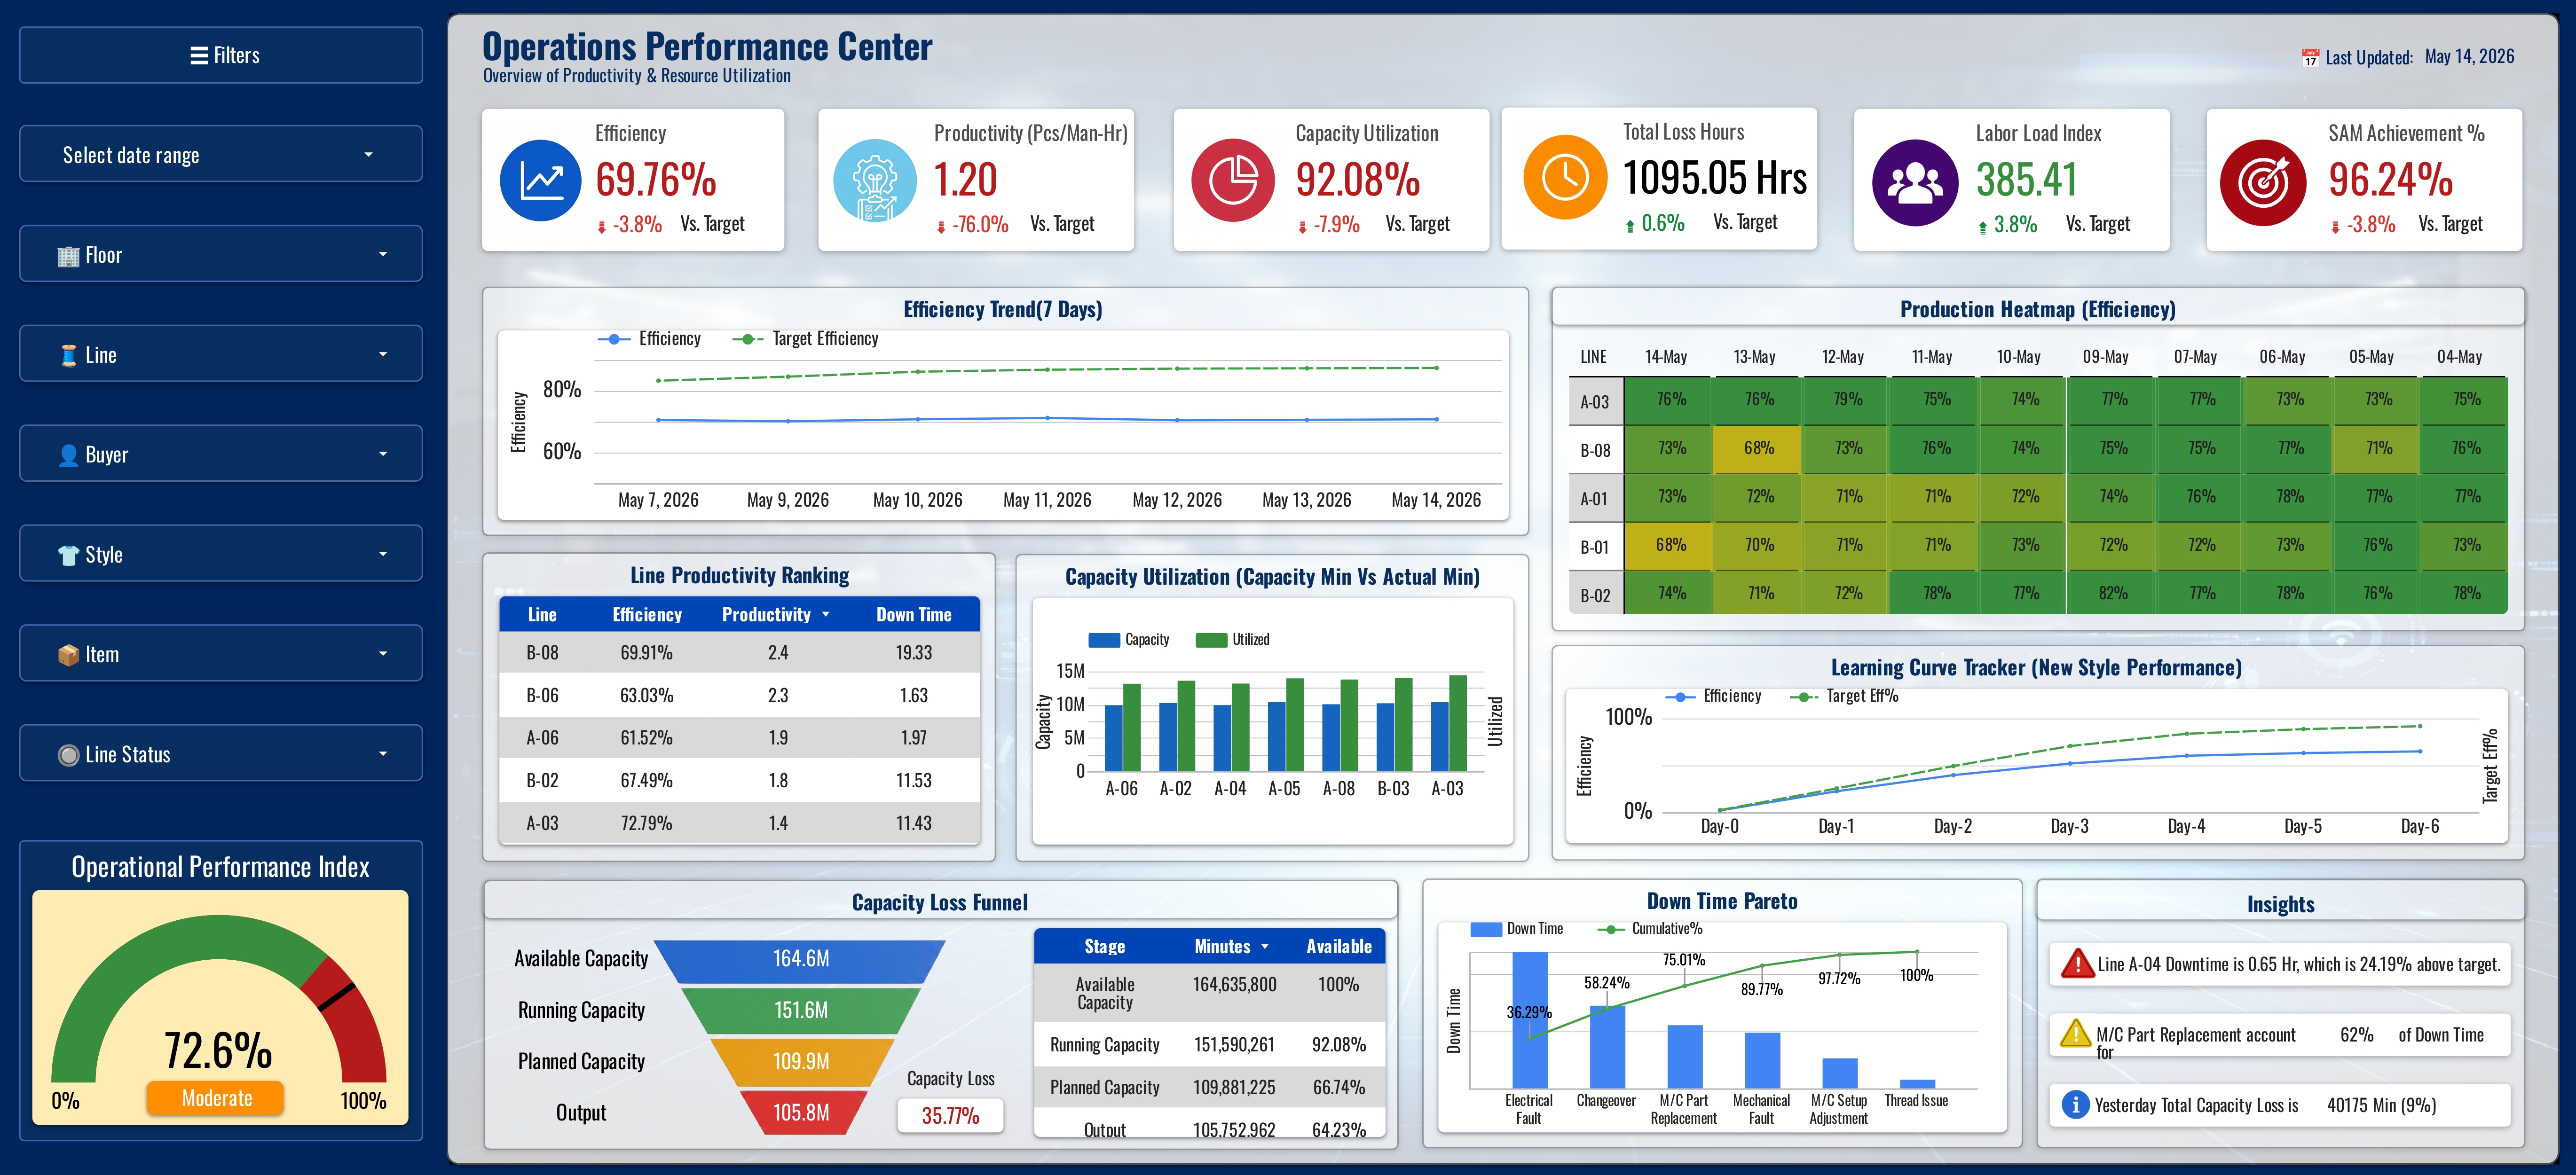
Purpose: The cross-functional operational layer integrating downtime analysis, capacity utilization, and composite risk scoring. Downtime is tracked by cause category (mechanical, material, process, personnel) enabling targeted corrective action rather than aggregate reporting. Capacity utilization per line reveals planning alignment gaps, lines running significantly below theoretical capacity indicate either underloading or systemic downtime issues. The Operational Risk Score is a composite KPI computed from weighted deviations across production, quality, and downtime dimensions, providing a single-number triage ranking across all 16 lines that management can action without needing to review individual KPIs.
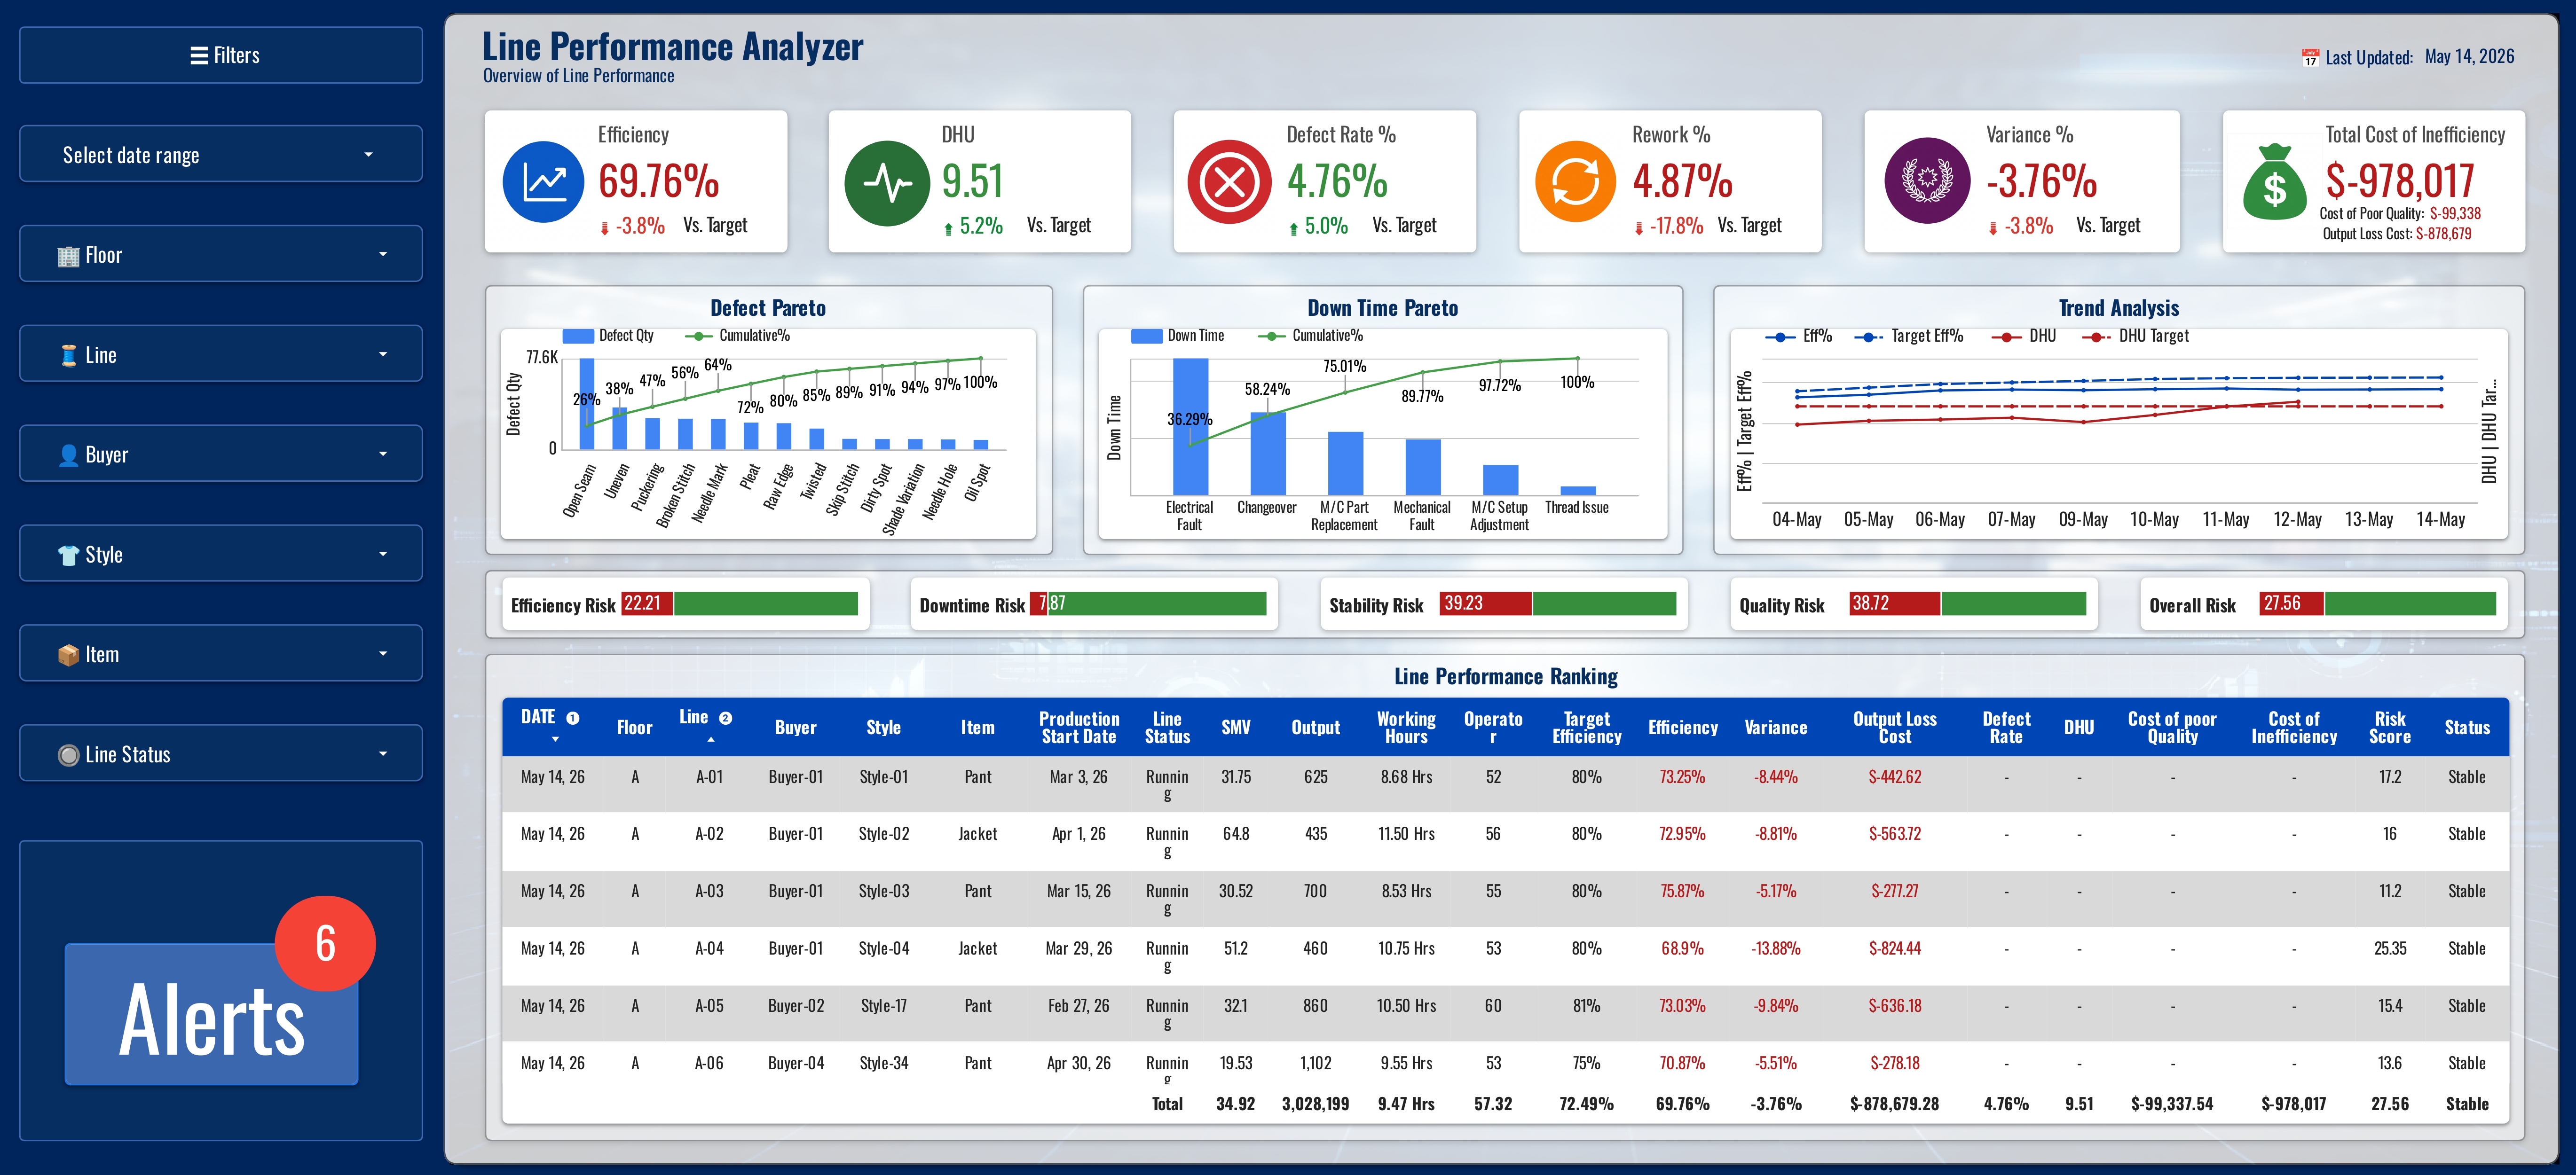
Purpose: The comparative intelligence layer, the page that answers "which lines need my attention today and why?" All 16 lines are ranked by sortable KPI: efficiency, output variance, DHU, downtime, and productivity. Top and bottom quartile lines are visually differentiated. Trend comparison overlays enable management to identify whether underperformers are declining, stable, or recovering, informing whether intervention is urgent or monitoring is sufficient. BA insight: This page was prioritized by production management as the highest-value view, it replaced the previous manual process of compiling and cross-referencing 16 separate spreadsheet tabs to identify where to focus supervisory attention each shift.
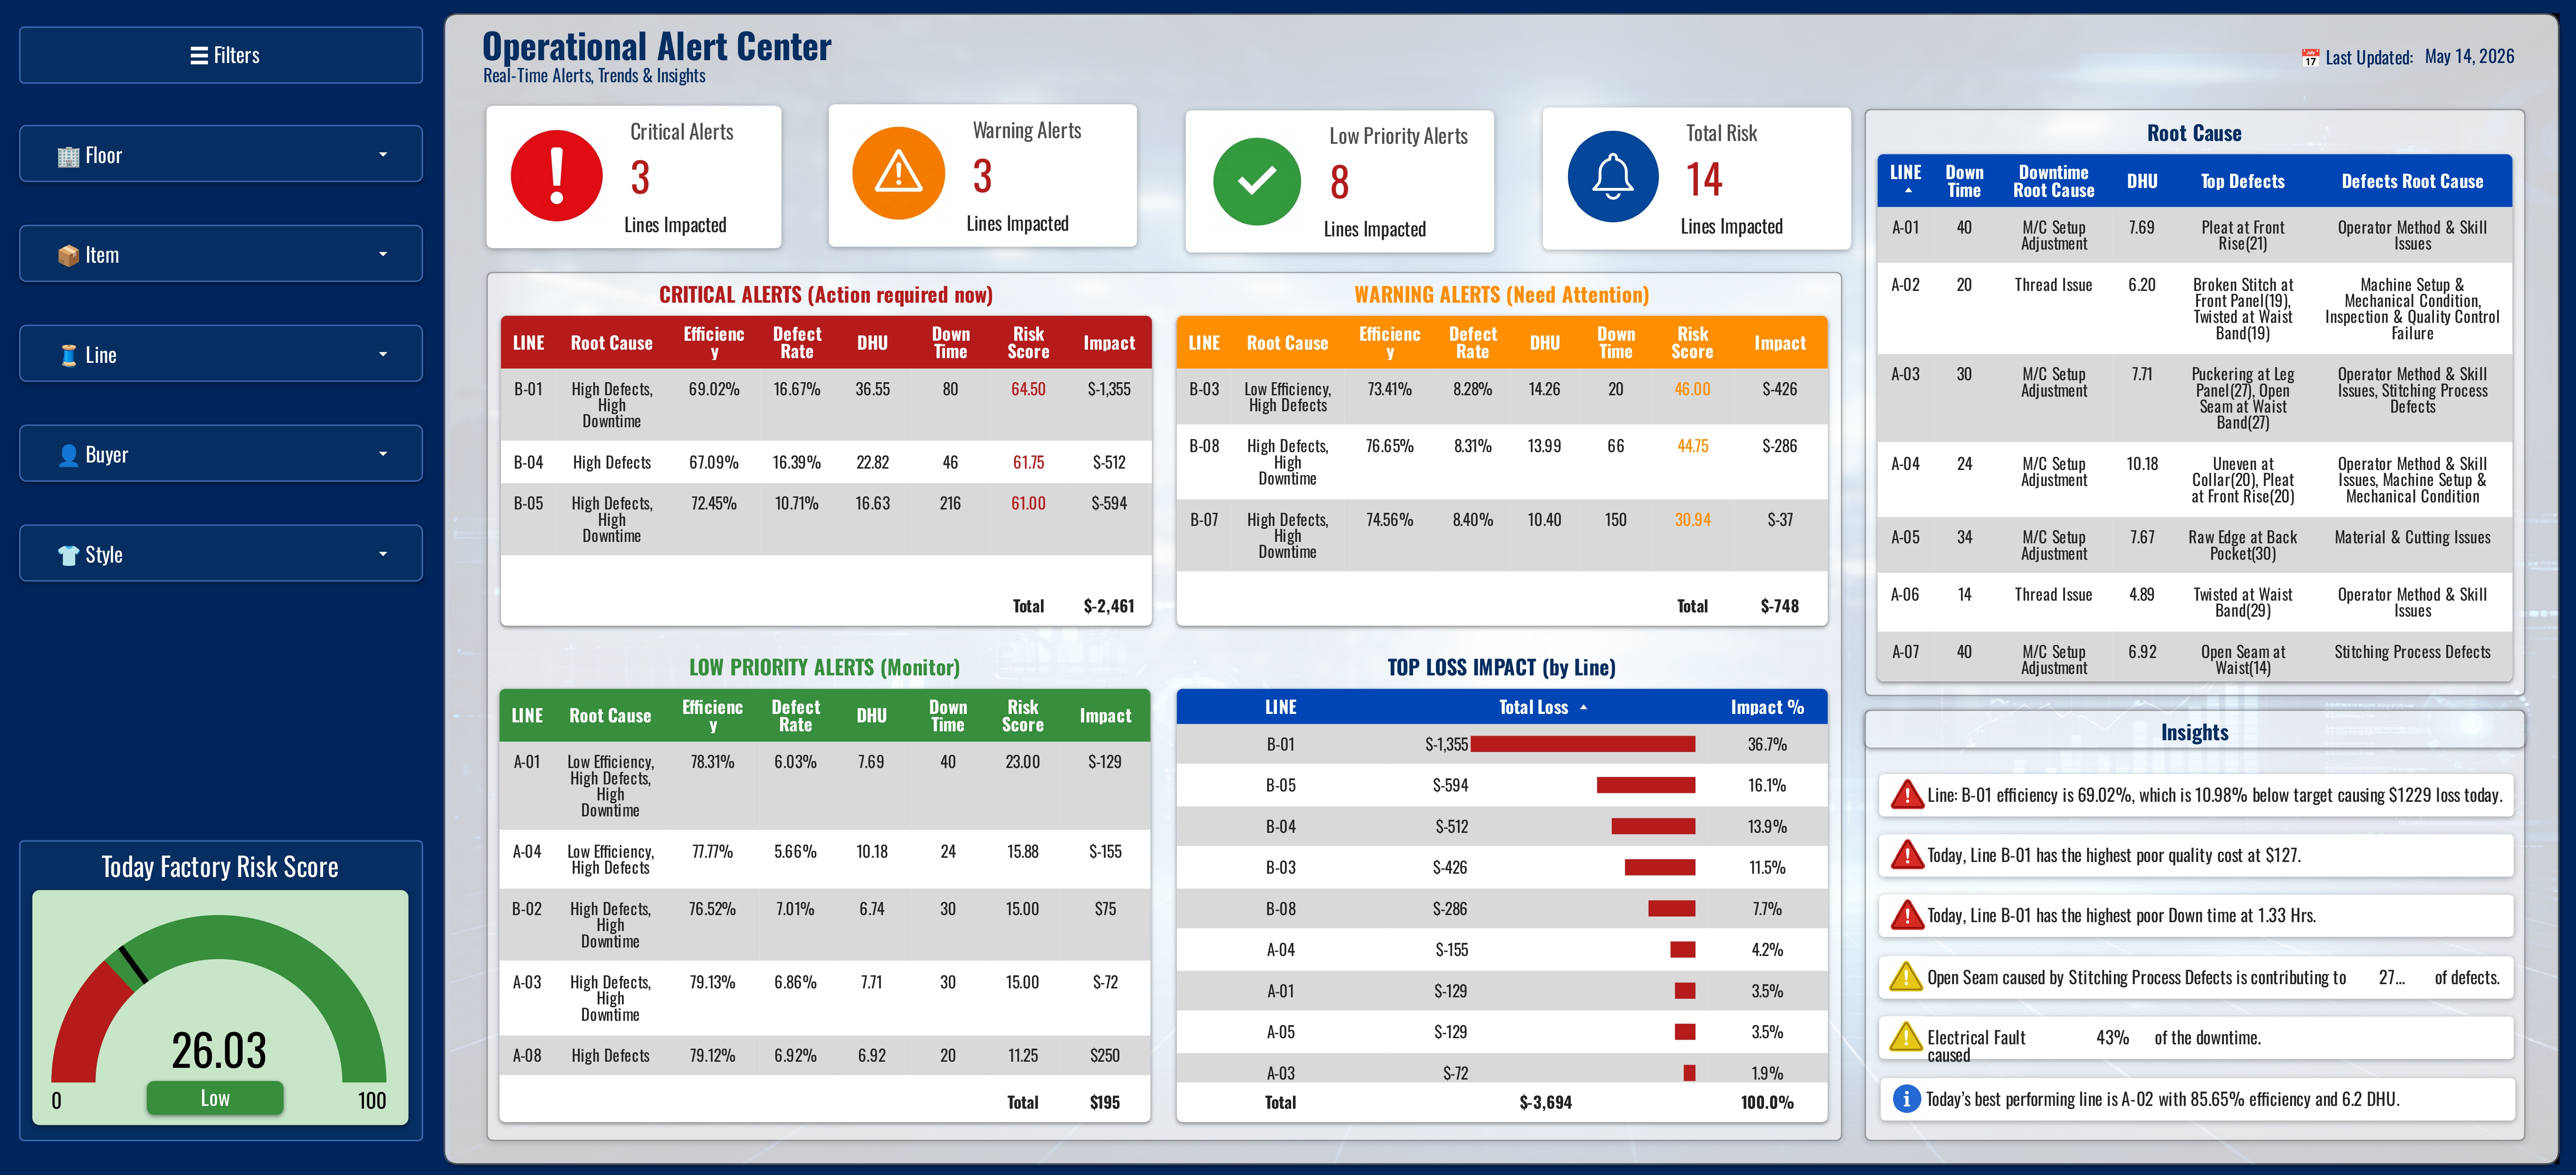
Purpose: The proactive risk management interface, the system's operational output. All KPI threshold breaches across all 16 lines are surfaced automatically in a single alert feed, classified by severity (Critical / Warning / Watch), and tagged with the affected line, KPI, deviation magnitude, and required escalation path. Six alert types run simultaneously: production efficiency drops, output target failure trajectories, DHU quality breaches, downtime escalations, reject rate violations, and composite risk score crossings. No supervisor has to manually detect any of these, the system detects, classifies, and surfaces them without human intervention. Organisational shift delivered: before the MCC, operational risks surfaced through informal channels after the fact. The Alert Center replaces that entirely, management sees what is wrong, on which line, how severe, and who needs to act, before the shift's losses have compounded.
The Automated Alerts & Intelligence Framework is what separates the MCC from a reporting tool. The design principle was simple: management should not discover problems; the system should flag them before the intervention window closes. Every alert type, insight rule, and severity threshold was built to answer a specific operational question faster than the previous process did.
DESIGN RATIONALE: Before the MCC, operational issues reached management through informal supervisor channels, typically after the shift, or when a problem had already compounded into a visible loss. The automation layer was not built to replicate this workflow digitally. It was built to replace it entirely with a proactive, always-on intelligence layer running across all 16 lines simultaneously, 24/7.
Alert logic sits in the Google Sheets calculation layer, not in the visualization. This means alerts are evaluated on every data entry, before any dashboard is opened. The Alert Center shows the current state; the logic that produces it runs upstream in the data model.
| Alert Type | Trigger Condition | Severity Logic | Decision It Enables | Pre-MCC State |
|---|---|---|---|---|
| Production Efficiency Alert | Line efficiency drops below defined threshold for the current shift period | Watch <5% below target · Warning 5–15% · Critical >15% | Immediate supervisory reallocation; line balancing intervention within the same shift | Discovered at shift-end report, too late to recover output |
| Output Target Failure Alert | Actual output vs. target deviation exceeds tolerance threshold mid-shift | Watch: on trajectory to miss by <5% · Warning: 5–10% gap · Critical: >10% gap | Production manager can reallocate operators, authorize overtime, or escalate before shift closes | Target miss identified next morning; no same-shift recovery possible |
| DHU Quality Breach Alert | Defects per Hundred Units exceeds the agreed quality threshold for any line | Watch: approaching threshold · Warning: at threshold · Critical: exceeding buyer limit | QA intervention dispatched before defective batch reaches end-of-line inspection; rework cost minimized | Quality issue identified at end-of-line; entire shift's output potentially affected |
| Downtime Escalation Alert | Cumulative downtime per line per shift exceeds defined per-shift maximum | Warning: 60–90 min/shift · Critical: >90 min/shift or single event >30 min | Maintenance team dispatched for mechanical failures; material replenishment triggered for supply gaps | Downtime causes logged at end of shift; root cause typically attributed generically |
| Reject Rate Escalation Alert | Reject rate exceeds tolerance threshold on any line in any single inspection period | Warning: approaching buyer tolerance · Critical: exceeding buyer SLA threshold | Prevents batch from advancing to packing; QA lead notified for same-shift corrective action | Rejection surfaced at final inspection or buyer audit, remediation cost significantly higher |
| Composite Risk Score Alert | A line's Total Alert Score (0–100) crosses the Warning threshold (≥30) or Critical threshold (>60) | Derived from a three-stage model: KPI deviations → penalty scores → weighted individual risks (Efficiency 40%, Quality 30%, Downtime 15%, Stability 15%) → single normalized score per line | Provides a single priority signal when multiple KPIs are simultaneously degraded on one line; prevents management attention dilution across 16 individual line views, one score replaces 4 × 16 = 64 individual KPI checks | No equivalent, cross-KPI risk triage was manually performed, infrequently, with significant delay |
The alert score is not a single threshold check. It is a three-stage model that converts multiple KPI deviations into a single normalized score from 0 to 100, giving a unified risk classification across all 16 lines at once. Each stage is documented below as implemented.
The three-stage model was chosen over simple per-KPI thresholds because operational risk is rarely one-dimensional. A line running at 82% efficiency with a rising DHU trend and an active style changeover presents a fundamentally different risk profile than a line at 82% efficiency in stable conditions. The composite score captures that difference and surfaces it as a single, actionable number, without requiring management to cross-reference four separate KPI views.
Automated insights go further than alert thresholds. Alerts answer whether something is wrong. Insights answer why, where it has happened before, and what pattern it follows. Before this layer, an IE analyst spent 60 to 90 minutes compiling trend data manually. The system now produces the same output on every data refresh.
| Insight Type | How It's Generated | Management Question It Answers | Dashboard Page |
|---|---|---|---|
| Rolling Efficiency Trend per Line | Efficiency calculated per line per period; rolling window applied; trend direction (improving / stable / declining) auto-classified | "Is this line's underperformance a one-shift anomaly or a structural decline requiring a line-balancing intervention?" | Production Performance Center |
| Downtime Root Cause Breakdown | Downtime events tagged by cause category (mechanical, material, process, personnel) at entry; auto-aggregated by line, shift, and period | "Why is this line losing time, and which team needs to respond?" Separates maintenance issues from supply chain issues from operator issues. | Operations Performance Center |
| Defect Category Pattern Analysis | Defects logged by type at inspection; frequency by category calculated per line; dominant defect type auto-identified | "Is this quality problem operator-skill-driven (process training), or material/process-driven (supplier or method issue)?" Directs corrective action to the right root cause. | Quality Performance Center |
| Line Performance Ranking | All 16 lines ranked automatically by any KPI on every data refresh; top and bottom quartile auto-classified; change in rank tracked period-over-period | "Which three lines need my attention most today, and has the answer changed since yesterday?" Replaces the 16-tab manual comparison. | Line Performance Analyzer |
| Composite Operational Risk Score | Three-stage scoring model: (1) KPI deviations mapped to penalty scores via penalty matrix; (2) four individual KPI risk scores computed (Efficiency, Quality, Downtime, Stability); (3) weighted combination produces a 0–100 alert score per line, updated on every data entry | "If I have 2 minutes before a management meeting, which line is in the most trouble across all dimensions simultaneously?" One score per line eliminates the need to review 16 × 4 KPIs manually, and flags multi-KPI deterioration that individual alerts would surface separately. | Operations Performance Center · Factory Command Center |
| Production Variance Insight | Output variance (actual − target) calculated per line per shift; cumulative shift variance tracked; variance by line auto-ranked | "How much output are we behind, on which lines, and is the gap closing or widening as the shift progresses?" | Production Performance Center · Factory Command Center |
| Quality Risk Trajectory | DHU trend per line plotted over rolling periods; trajectory direction calculated; proximity to buyer threshold quantified automatically | "Is this line's quality deteriorating, stable, or recovering, and how many more defects before we breach the buyer threshold?" Enables pre-emptive action, not just reactive response. | Quality Performance Center |
The automation architecture was a deliberate BA design choice: compute intelligence in the data model, not the visualization layer. This means alerts and insights are available whether or not a dashboard is open, and that any authorized user opening any page sees current intelligence, not a stale snapshot.
| Capability | Before MCC | After MCC | Time Saved |
|---|---|---|---|
| Efficiency alert on underperforming line | Supervisor notices; reports verbally at shift end or next day | Alert fires automatically within minutes of data entry; visible to all authorized users immediately | 4–7 hours |
| Quality DHU breach identification | End-of-line inspection; QA report filed post-shift | DHU alert generated as soon as inspection data entered; QA lead sees it on the Alert Center | 3–6 hours |
| Root cause of downtime | Informal supervisor notes; manual aggregation at week-end review | Downtime cause auto-aggregated by category on every data entry; breakdown visible on Operations page instantly | Days → minutes |
| Identifying which of 16 lines needs attention first | Manual review of 16 separate spreadsheet tabs; ~30–60 min/day | Line Performance Analyzer ranks all 16 lines by any KPI in under 10 seconds; auto-updated | ~30–60 min/day |
| Cross-KPI risk triage for a single line | No structured equivalent; relied on individual supervisor judgment | Composite risk score computed automatically; single number per line visible on Factory Command Center | Previously impossible at scale |
| Quality trend trajectory vs. buyer threshold | Retroactive analysis only; required IE analyst time to compile | Rolling DHU trend calculated automatically; proximity to threshold shown on Quality Performance Center | 60–90 min → real-time |
The RTM maps every functional requirement to its originating business objective, the user story it supports, and the acceptance criteria that confirmed delivery. It provides the audit trail for any post-delivery requirement dispute.
| FR ID | Business Objective | User Story | Dashboard Deliverable | Acceptance Criteria Met | Status |
|---|---|---|---|---|---|
| FR-01 | BO-1 · Eliminate fragmented reporting | US-01, US-04 | All 6 pages, unified data model | Single data model serving all dashboards; no parallel sheets | VERIFIED |
| FR-02 | BO-3 · Standardize KPI definitions | US-04, US-10 | All pages, consistent KPI logic | IE & QA sign-off obtained; efficiency variance eliminated | VERIFIED |
| FR-03 | BO-2 · Real-time monitoring across 16 lines | US-01, US-02, US-03, US-06, US-09 | Factory CC · Production · Quality · Operations · Line Analyzer | All 6 pages functional; 16 lines monitored; interactive filters operational | VERIFIED |
| FR-04 | BO-4 · Implement automated alert system | US-05 | Operational Alert Center (Page 6) | All 6 alert types active; severity classification applied; Alert Center live; thresholds in config sheet; edge-case logic validated | VERIFIED |
| FR-04b | BO-5 · Automated intelligence layer | US-07, US-08, US-09 | All pages, insight outputs; Line Analyzer; Operations; Quality | Trend classification, root cause aggregation, defect pattern, risk score, and ranking all auto-computed on data entry | VERIFIED |
| FR-05 | BO-2 · Real-time monitoring · Line comparison | US-02 | Line Performance Analyzer (Page 5) | Sortable ranking operational; top/bottom quartile differentiated | VERIFIED |
| FR-06 | BO-5 · Enable trend analytics & root cause | US-06, US-08, US-09 | Production · Quality · Operations pages | Trend charts live; downtime cause breakdown operational; defect category analysis functional | VERIFIED |
| FR-07 | BO-5 · Proactive operational management | US-07 | Operations Performance Center (Page 4) | Composite risk score calculated per line; high-risk lines visually differentiated | VERIFIED |
| NFR-01 | BO-2 · Operational usability | US-01, US-02 | All dashboard pages | All pages load ≤5 seconds; Sheets recalculates ≤3 seconds | VERIFIED |
| NFR-02 | BO-2 · Shift-hour availability | All | System-wide | Google Workspace SLA baseline accepted; no planned downtime during shift hours | VERIFIED |
| NFR-03 | BO-6 · Reduce manual effort | US-01, US-07 | All dashboard pages | 3 management users navigated all pages without assistance in UAT session | VERIFIED |
| NFR-04 | BO-3 · Data integrity | US-03, US-04 | Data model layer | 20 test records validated — 100% match to manually calculated expected values | VERIFIED |
| NFR-05 | Post-delivery sustainability | — | Configuration sheet + handover doc | Thresholds in config sheet; handover document delivered | VERIFIED |
| NFR-06 | Data security | — | Access control configuration | Edit access restricted to BA + IE data entry; view-only for management via Google Data Studio | VERIFIED |
All 13 requirements (7 functional + 6 non-functional) verified against acceptance criteria. Zero open items at final sign-off. The RTM was used as the primary UAT sign-off checklist, each row was ticked off in a joint session with IE Lead, QA Manager, and Factory Management before the system was declared production-ready.
| Business Objective | Outcome | Status |
|---|---|---|
| Eliminate fragmented multi-spreadsheet reporting | Single data model in Google Sheets serves all 6 dashboard pages; no parallel spreadsheet reporting required | ACHIEVED |
| Enable real-time KPI monitoring across 16 lines | All 16 lines monitored simultaneously across 15+ KPIs; near-real-time refresh on data update | ACHIEVED |
| Standardize KPI definitions across IE, QA, Production | Definitions signed off by IE Lead and QA Manager; single formula applied consistently; zero definitional disputes post-implementation | ACHIEVED |
| Implement threshold-based alert system | 6 alert types active across all KPI dimensions; severity classification applied automatically; Alert Center operational, alerts fire within 3 seconds of data entry, eliminating the previous 5–7 hour lag between event and management awareness | ACHIEVED |
| Enable trend analytics and root cause visibility | Trend charts on production and quality pages; downtime cause breakdown; defect category analysis, all operational. Automated insight layer classifies trend direction, aggregates downtime by category, and identifies dominant defect type per line on every refresh, replacing an estimated 45–60 min/day of manual analytical compilation | ACHIEVED |
| Reduce manual reporting effort by ≥70% | Estimated 70% reduction achieved: automated KPI calculations eliminate data compilation; the alert engine removes manual KPI monitoring across 16 lines; the automated insights layer eliminates manual trend and root cause analysis, directly addressing PP-03 (5–7 hour reporting lag) and PP-07 (3.5–5 hrs/day manual effort) | ACHIEVED |
- Created the first centralized single source of truth for factory performance across production, quality, and operations
- Eliminated multi-team spreadsheet reconciliation, previously consuming 1–2 hours of IE and QA time daily
- Shifted factory management from reactive (data arrives after the shift) to proactive (alerts fire during the shift)
- Enabled production leadership to rank all 16 lines by any KPI in under 10 seconds, previously impossible without manual compilation
- Standardized KPI definitions accepted across IE, QA, and Production for the first time, resolving a cross-departmental alignment gap
- Provided buyer-audit-ready quality reporting infrastructure supporting QCO compliance requirements
- Demonstrated viability of the same architecture for live deployment, the simulated build was built to production-ready specification
The Manufacturing Command Center transformed fragmented, reactive, manual manufacturing reporting into a centralized, real-time decision intelligence system, with an automated alert engine that detects, classifies, and surfaces operational risks across all 16 lines simultaneously without human intervention, and an automated insights layer that replaces hours of manual analytical work with instant, always-current intelligence on every data entry. Every design decision, from KPI definition to alert threshold to insight rule to dashboard layout, was made in direct service of a specific management decision that needed to be faster, better-informed, and more reliable. The result: management no longer discovers problems after the fact. The system finds them first.
Documenting only what was built leaves out the most useful part: what changed in how you work as a result. The observations below are recorded to improve practice on the next engagement, not to round off the document.
- Live data ingestion: replacing manual entry with a direct Google Forms or Apps Script pipeline from supervisor inputs, eliminating the data entry lag and human error vector entirely
- Expanded scope: cutting section and finishing section KPIs, currently out of scope, are natural extensions once the sewing floor model is validated in live deployment
- Predictive alert logic: current alerts are threshold-reactive; a v2.0 intelligence layer would incorporate rolling trend velocity to fire predictive alerts before a threshold is breached, flagging lines in deterioration trajectory, not just lines already in breach
- Buyer-facing report automation: QCO compliance data currently requires manual extraction from the dashboard; a v2.0 would generate a structured buyer-ready summary on demand from the same data model
The most important lesson from this project was not technical. It was that the quality of a BI system is determined before the first formula is written, in the requirement sessions, the conflict resolutions, and the definition sign-offs that establish what the system is actually supposed to measure. Every hour invested in that groundwork returned multiples in build confidence and zero post-launch disputes.