& OEE Implementation
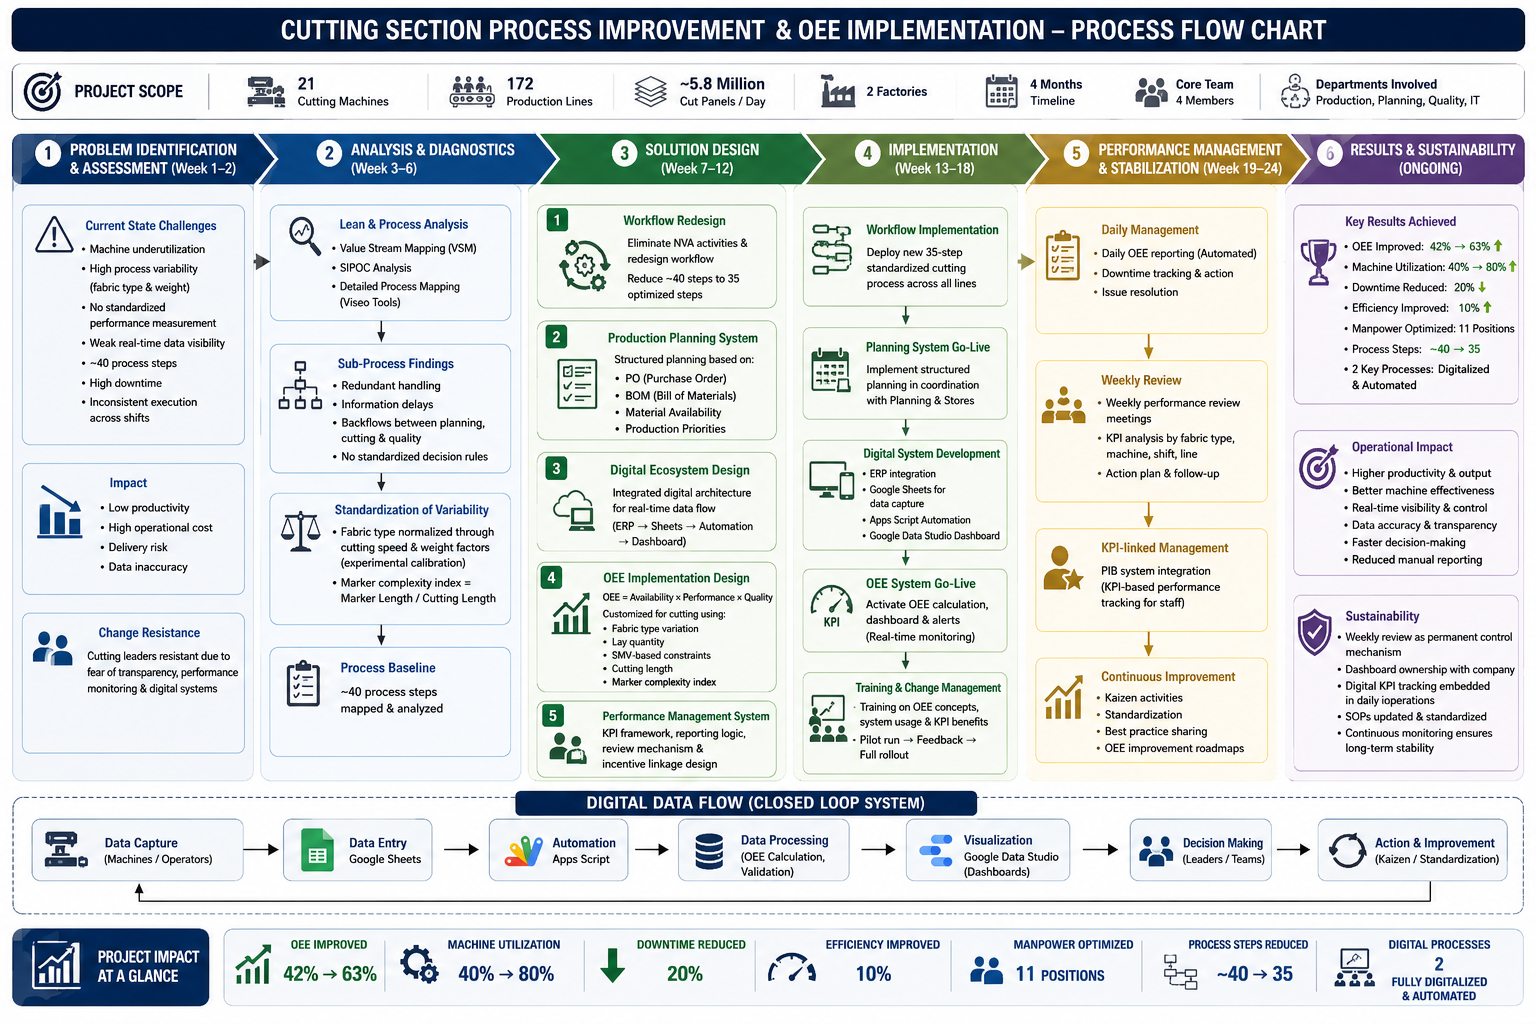
Across 21 cutting machines at Snowtex Group, producing roughly 5.8 million cut panels daily, machine utilization sat at 40% and OEE at 42%. The workflow ran to about 40 steps with significant redundancy and backflow. Performance assessment was informal, and no methodology existed for accounting for fabric type or marker complexity in cross-machine comparisons.
Project mandate: transform the cutting section from a manual, fragmented operation into a digitally enabled, KPI-driven system, and establish a replicable model for the organisation.
- Implement a standardised, customised OEE framework as the primary cutting machine performance KPI
- Redesign the cutting workflow, eliminate non-value-added steps, reduce process count, and embed decision rules at all variation points
- Introduce a structured production planning system driven by PO, BOM, material availability, and priority logic
- Build and deploy a fully integrated digital monitoring ecosystem: ERP → Google Sheets → Apps Script → Data Studio
- Establish a KPI-driven performance management system with automated daily OEE reporting and weekly review cadence
- Reduce downtime, improve machine utilization, and optimise manpower allocation through data-driven visibility
- Overcome cutting leader resistance through structured training, pilot demonstration, and PIB-linked accountability
| Stakeholder | Role | Key Interest | Engagement |
|---|---|---|---|
| Production Dept. | Primary operational owner; machine output and shift execution | Improved throughput, reduced downtime, planning predictability | HIGH · Decision Authority |
| Planning Dept. | PO sequencing, material scheduling, priority alignment | Structured planning model; fewer operational interruptions | HIGH · Co-Design Partner |
| Quality Dept. | Audit, defect tracking, OEE Quality component inputs | Accurate quality measurement; defect traceability by machine | MEDIUM · Input Provider |
| IT Dept. | ERP integration support and post-handover maintenance | Clean data architecture; scalable ERP integration | MEDIUM · Technical Delivery |
| Cutting Leaders | Floor-level workflow execution and daily data entry | Initially resistant, feared transparency and monitoring | HIGH · Change Risk · Resolved |
| Senior Management | Sponsor; recipient of dashboards and performance reporting | Operational visibility, cost reduction, OEE evidence | SPONSOR · Approval Authority |
Current-state assessment used Value Stream Mapping (VSM) to identify waste, SIPOC analysis to map subprocess boundaries, and Viseo process modelling for step-level documentation. Together these gave a precise picture of where redundancies, backflows, and decision gaps sat in the workflow.
| Inefficiency | Root Cause | Operational Impact | Priority |
|---|---|---|---|
| Machine underutilization — 40% | No scheduling framework; allocation based on supervisor discretion | 60% of capacity unused during schedulable windows | CRITICAL |
| High variability across fabric types | No engineering standard for speed or lay quantity adjustment by fabric | No valid basis for cross-machine or cross-shift comparison | CRITICAL |
| No standardised performance measurement | No OEE or equivalent KPI defined; effectiveness assessed qualitatively | Underperformance undetected; no accountability baseline | CRITICAL |
| Weak real-time visibility | Manual, end-of-shift data capture only; no live monitoring | Management decisions on stale data; problems found hours late | HIGH |
| Inefficient ~40-step workflow | Organically grown workflow; redundant handling and information delays | Backflows between planning, cutting, and quality; non-value-added touchpoints | HIGH |
| High downtime, inconsistent shifts | No downtime tracking; no standardised decision rules across shifts | Downtime unmeasured; shift-to-shift output variance significant | HIGH |
| Cutting leader resistance | Fear of transparency, performance monitoring, and digital systems | Risk of non-adoption; potential data manipulation or withholding | HIGH · People Risk |
OEE measurement required neutralising operational variability before any valid KPI comparison was possible. Four calibration frameworks were built:
Problem: Different fabrics require different cutting speeds. Without normalisation, heavyweight denim would always appear lower-performing than lightweight voile, regardless of actual effectiveness.
Solution: Controlled experiments determined cutting speed and weight factors per fabric category. These coefficients were embedded in the OEE Performance component, enabling fair cross-style comparison.
Problem: High-complexity markers require significantly more cutting time. Without a complexity index, OEE would penalise machines assigned complex markers relative to simple ones.
Solution: Marker complexity defined as Cutting length ÷ Marker length — a single comparable index capturing layout density. Performance targets scale proportionally to complexity.
Problem: A machine cutting a 100-ply lay faces substantially greater resistance and cycle time than one cutting a 30-ply lay of the same fabric. Comparing both against an identical output target penalises higher-ply operations and distorts cross-machine performance scores.
Solution: A lay quantity factor was derived by analysing output rates across historical lay depths. The factor scales the Performance target proportionally to the number of plies, so expected output rate decreases as lay quantity increases, maintaining fairness across all job configurations.
Problem: Round knives and straight knives operate at fundamentally different effective cutting speeds and produce different levels of cutting resistance. Comparing machines running different blade types against the same target systematically misrepresents their effectiveness.
Solution: A knife/blade type coefficient was established per blade category through controlled trials. The coefficient scales the Performance target so that machines are only ever measured against a target appropriate to the blade type in use on that shift.
Five solution components were designed and implemented in sequence, each handling a distinct operational layer. OEE depends on clean digital data. The management system depends on a valid OEE model. Adoption depends on a measurement framework operators can verify as fair. The sequence was not arbitrary.
Non-value-added steps identified through VSM were removed and standardised decision rules were embedded at all variation points. Result: roughly 40 steps reduced to 35, with 2 of those fully digitalised and automated.
- PO-driven sequencing: Cutting order set by delivery date and buyer priority, not supervisor discretion
- BOM verification gate: Bill of Materials confirmed against physical inventory before entering the cutting schedule
- Material confirmation: Fabric inspection and shrinkage test cleared before any cutting commences
- Priority conflict rule: Documented escalation logic replaces informal supervisor negotiation
| OEE Component | Standard Definition | Garment Cutting Customisation | Key Variables |
|---|---|---|---|
| Availability | Planned time minus downtime as % of planned time | Downtime segmented by category (breakdown, changeover, maintenance) for targeted corrective action | Planned time, downtime by type, shift schedule |
| Performance | Actual vs theoretical maximum output rate | Theoretical max adjusted by fabric type coefficient, lay quantity constraint, knife/blade type coefficient, and SMV-based speed limit derived from IQR-cleaned historical data | Fabric coefficient, lay quantity, knife coefficient, SMV, cutting length |
| Quality | Good units vs total units started | Defects classified as fabric-origin (excluded) or process-origin (included) to reflect operator-attributable quality only | Total panels, rework panels, defect classification |
| Marker Complexity Index | Not in standard OEE | Cutting length ÷ Marker length ratio normalises Performance targets; complex markers do not systematically understate effectiveness | Marker length, cutting length, complexity ratio |
Calibration note: Generic OEE benchmarks (e.g. 85% world-class) are derived from stable discrete manufacturing. The garment cutting environment, with frequent style changeovers, fabric transitions, and marker complexity variation, has a structurally lower OEE ceiling. All bands above are context-calibrated.
Each machine's performance target cannot be a fixed number. It changes with fabric type, lay quantity, marker complexity, and blade type. A dedicated data pipeline was built to continuously mine historical cutting output, remove anomalous observations using IQR, and recalibrate SMV values from the cleaned dataset.
Why IQR? Raw cutting data contains legitimate anomalies, machine stoppages mid-record, test runs, and operator errors during data entry. Using uncleaned data to derive SMV inflates variance and produces targets that are either too aggressive or too lenient. The IQR method trims the tails of each machine's speed distribution automatically, without manual intervention, ensuring targets track actual operational capability rather than noise.
| Input Variable | Role in Target Calculation | How It Is Set |
|---|---|---|
| Fabric Type & Weight | Scales the theoretical cutting speed ceiling, heavier fabrics lower the ceiling | Coefficient table from Calibration 01 controlled experiments |
| Lay Quantity | Adjusts target for the number of plies, thicker lays require proportionally more time per cut | Measured per job; lay quantity factor applied per Calibration 03 |
| Marker Complexity Index | Adjusts target for layout density, higher complexity ratio increases allowed cutting time | Derived from marker length ÷ cutting length per Calibration 02 |
| Knife / Blade Type | Accounts for the speed differential between round and straight knives | Coefficient table from Calibration 04; logged at shift start |
| SMV (from IQR-cleaned history) | Sets the baseline expected time per unit under normal conditions | Median of IQR-filtered historical speed distributions per machine segment; recalculated daily |
- Daily OEE reporting: Automated via Apps Script, machine-level scores generated each morning; exceptions flagged automatically without manual intervention
- Weekly review meetings: Permanent standing meetings with cutting leaders and production management. OEE trends reviewed, downtime attributed, improvement actions assigned with owners
- Cutting leader training: Leaders trained on OEE logic and calculation, converting the KPI from an abstract number into an actionable operational signal
- PIB-linked tracking: Staff performance linked to OEE via PIB incentive system, providing direct motivation aligned with improvement targets
OEE design was finalised before the digital ecosystem was built. The performance management framework was validated with supervisors before it was used for staff accountability. No phase started on an unconfirmed output.
Challenge: Cutting leaders withheld cooperation from data entry during early implementation, fearing punitive use of accurate data and target escalation. The risk was a system producing confident-looking OEE numbers built on incomplete input.
Action: Structured training sessions delivered directly on the floor explained exactly what the OEE model captured and what it was not used for. Pilot demonstrations showed leaders their machine's actual OEE score vs their prior manual estimates. The PIB link was presented as a direct benefit, higher OEE means higher incentive. Onboarding was gradual, starting with the most receptive leaders to build visible success cases.
Challenge: Auto-cutter machines' native reporting did not map cleanly onto the OEE engine's data schema, creating Availability and Performance gaps that would have produced silently inaccurate OEE scores for a significant portion of the machine fleet.
Action: Apps Script was developed iteratively, with auto-cutter-specific validation at each release. Data entry templates were redesigned with structured input fields matching the engine's schema requirements. Manual spot-checks ran in parallel until automated outputs were confirmed accurate.
Both challenges required engineering a verifiable system change, not communication alone. The correct response was never to override the objection, but to remove its technical basis and demonstrate that removal through evidence.
| Milestone | Timepoint | OEE | Band | Note |
|---|---|---|---|---|
| Baseline | Project initiation | 42% | Poor · <45% | No structured OEE measurement; utilization 40%; daily output ~5.8M panels |
| Project Delivery | Month 4 | — | — | Workflow redesign, digitalization, OEE engine, and PIB policy fully implemented and handed over; 22 manual cutter positions optimised across 11 floors |
| 6-Month Review | Month 6 post-go-live | 63% | Average · 45–64% | Machine utilization 80%; downtime −20%; cutting leaders independently presenting OEE in weekly reviews |
| 12-Month Sustained | Month 12 post-go-live | 66% | Good · 65–74% ✓ Target | Post-implementation target band achieved; system self-sustaining without project team involvement |
Target achieved: The 12-month OEE of 66% confirms the system continued improving after project close, the strongest evidence that institutionalisation was effective. The post-implementation target band (65–74%) was reached within one year of go-live.
| Objective | Delivered | Impact | Status |
|---|---|---|---|
| Standardised OEE framework | Custom OEE model with fabric, lay, SMV, knife/blade type, and marker complexity adjustments; IQR-based daily anomaly removal; automated daily calculation | OEE 42% → 63% (6-month) → 66% (12-month); target band (65–74%) achieved; machine-level score available daily without manual calculation | ACHIEVED |
| Workflow redesign | ~40 steps → 35 (5 eliminated); 2 of the remaining 35 processes fully digitalised; standardised decision rules at all variation points | 12.5% process step reduction; cross-shift execution consistency improved | ACHIEVED |
| Production planning system | PO-BOM-material-priority framework live; integrated with ERP; Planning dept. independent post-handover | No mid-process stops from unconfirmed material post-implementation; planning decisions auditable | ACHIEVED |
| Digital monitoring ecosystem | ERP + Sheets + Apps Script + Data Studio operational across both factories | Manual reporting eliminated; management decision latency reduced from shift-end to same-day automated reporting | ACHIEVED |
| Downtime reduction & utilization | Downtime tracked by category; utilization monitored daily; targeted corrective action enabled | Downtime −20%; machine utilization 40% → 80% — both measured at 6-month post-go-live review | ACHIEVED |
| Manpower optimisation | OEE-driven visibility enabled evidence-based reallocation; 22 manual cutter operator positions optimised across 11 floors by project close | 22 manual cutter positions reallocated without output reduction, supported by OEE capacity data; daily panel output maintained at ~5.8M | ACHIEVED |
| Change resistance overcome | Training, pilot demonstration, and PIB linkage executed; full cutting leader adoption achieved | Leaders operate system and present OEE independently; zero BA dependency at project close | ACHIEVED |
- Weekly review embedded permanently: Standing production management event, owned internally, not by the project team
- Dashboard ownership transferred: Apps Script and Data Studio operated by IT and production management as a standard operational tool
- SOPs updated: All 35 optimised steps documented in revised standard operating procedures
- Continuous exception monitoring: Apps Script flags machines deviating from OEE benchmarks, enabling early intervention without manual oversight
- Output maintained at baseline volume: Daily panel output held constant at ~5.8M, efficiency gains were realised through manpower optimisation and machine utilization improvement, not output expansion
- Model standardised organisation-wide: OEE framework documented as a replicable model for future improvement initiatives across other departments
| Risk | Category | Likelihood · Impact | Mitigation | Outcome |
|---|---|---|---|---|
| Cutting leader non-adoption, data withholding or manipulation | People · Change | High · Critical | OEE training; pilot demonstrations with live data; PIB linkage framed as benefit; gradual onboarding from receptive leaders outward | MATERIALIZED · RESOLVED — Non-cooperation in early implementation. Resolved through training and PIB demonstration. Full adoption before project close. |
| OEE calibration error, fabric or marker coefficients producing unfair scores | Technical · Data | Medium · Critical | Experimental calibration before engine build; validated against historical data; stakeholder sign-off on OEE design before activation | MITIGATED — Calibration validated across multiple fabric types. No scoring anomaly post go-live. |
| Auto-cutter data gap, schema incompatibility causing silent inaccuracy | Technical · Infrastructure | Medium · High | Iterative Apps Script builds with auto-cutter-specific validation; template redesign; manual cross-check before automation accepted | MATERIALIZED · RESOLVED — Gap confirmed during build. Resolved through iterative development and template redesign. |
| ERP integration delay blocking digital ecosystem deployment | Delivery · Dependencies | High · Medium | Google Workspace designed as a fully functional interim platform; ERP integration treated as a parallel workstream, not a prerequisite | MITIGATED — Workspace ecosystem deployed independently. ERP integration continued as a separate workstream post-close. |
| OEE benchmark misalignment, inappropriate targets demotivating leaders | Design · Stakeholder | Medium · High | Bands calibrated to garment cutting context; Production and Planning sign-off before activation; bands reviewed after first month | MITIGATED — Context-calibrated bands accepted. No objection raised post-activation. |
| Assumption | Owner | Validation Status | Impact if Incorrect |
|---|---|---|---|
| ERP planned production time data is available and accurate for Availability calculation | IT / Planning | VALIDATED — ERP data confirmed consistent with shift records; used as Availability denominator without adjustment. | Manual planned-time reconstruction required, increasing data entry burden and accuracy risk |
| Fabric type classifications used in calibration represent the stable production mix | Planning / Production | VALIDATED — Fabric mix stable throughout. New fabric types post-close would require recalibration. | OEE Performance coefficients inapplicable to uncalibrated materials, inaccurate scores for new fabric styles |
| Cutting leaders available for training without significant output disruption | Production Management | VALIDATED — Sessions scheduled during shift changeovers. No output loss during training windows. | Delayed training would extend resistance period; digital system could go live without adequate leader capability |
| IT will provide ERP schema access within the project timeline | IT Department | PARTIALLY VALIDATED — Schema access delayed by competing priorities. Google Workspace architecture absorbed the delay. | Without the interim platform, ERP delay would have blocked digital ecosystem go-live entirely |
| Senior management sustains commitment to weekly review post-closure | Senior Management | VALIDATED — Weekly reviews continue as a standing event; dashboard maintained without project team involvement. | Without sustained commitment, the review mechanism atrophies and OEE data reverts to an unmaintained artefact |
- Budget: No external software licences allocated, all infrastructure required to run within existing Google Workspace and ERP access, driving the Apps Script automation approach
- Timeline: Fixed 4-month window with no slack for fundamental redesign, making front-loaded analysis and phase-gate sign-offs essential risk controls
- IT capacity: ERP development resource shared across concurrent projects; ERP integration not guaranteeable within the timeline, making the interim Workspace architecture a design necessity
- Data entry burden: Shift data entry designed to be completable in under 10 minutes per machine to avoid placing unreasonable load on cutting leaders at shift-end
- Change management authority: No formal authority over cutting leaders, all adoption levers were influence-based (training, PIB linkage, demonstration), requiring a longer and more structured onboarding process