Effective PIB Implementation
The sample section had 5 lines, over 400 employees, and roughly 300 daily outputs, but no individual-level KPI measurement. Performance was assessed through line efficiency rankings, which were structurally unfair: operators on complex styles scored lower than operators on simpler ones, regardless of actual skill or effort. Supervisor assessments carried personal bias. Incentive decisions had no objective basis, and 1,000+ samples went missing annually with no accountability mechanism to trace them.
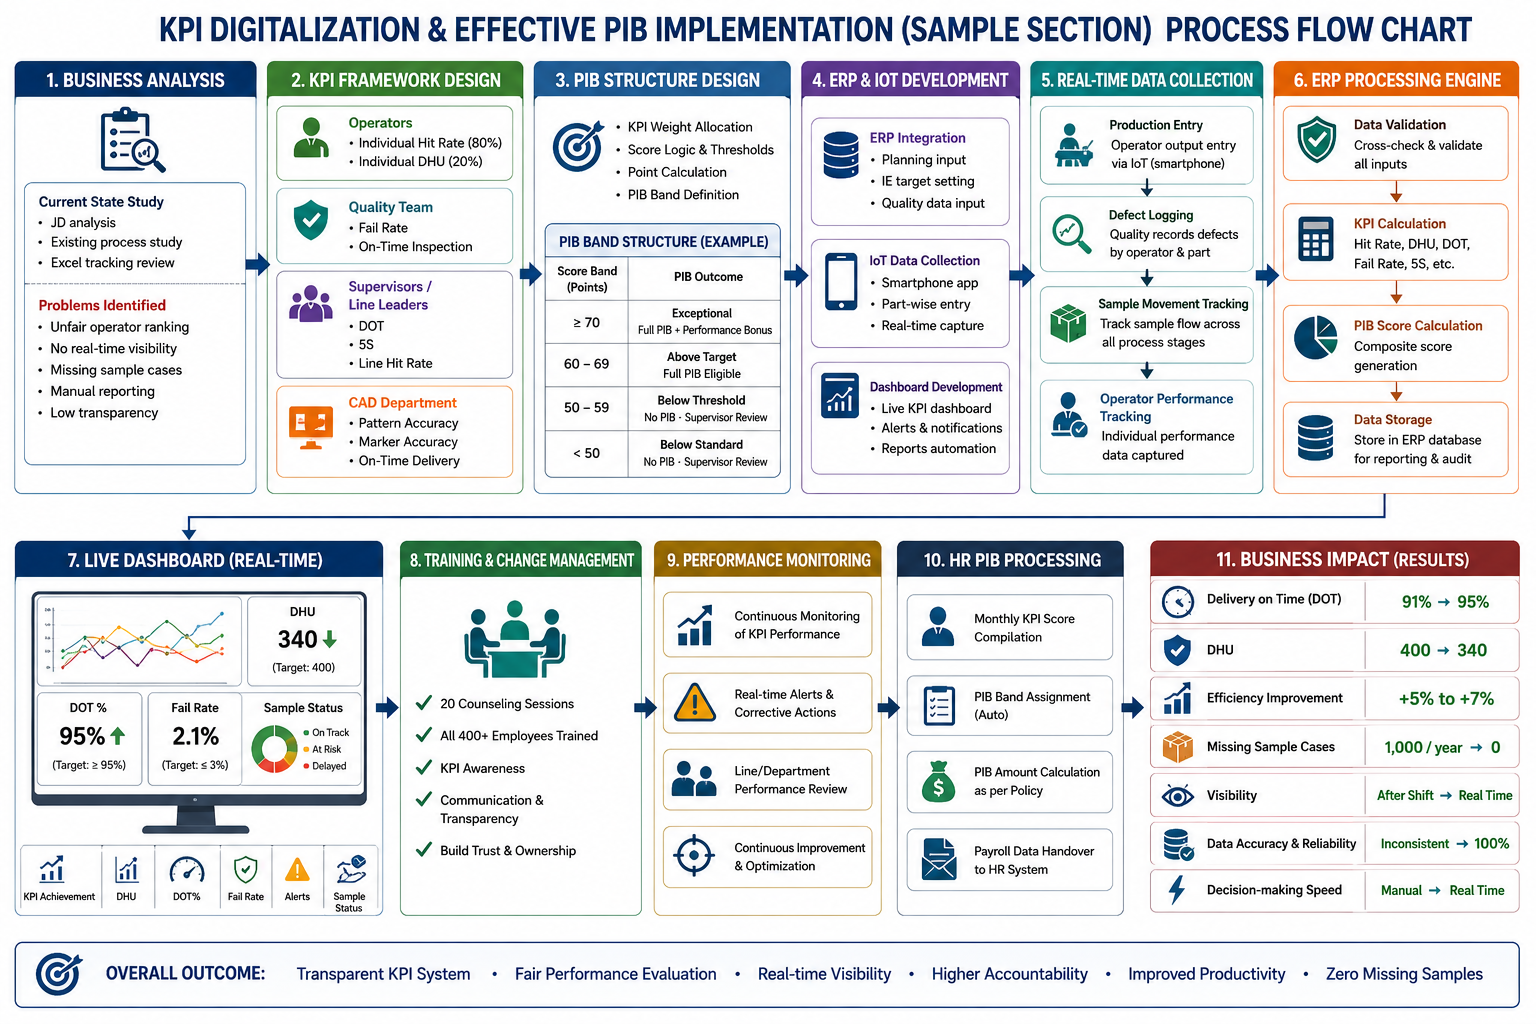
The mandate: replace this opaque system with a real-time ERP-driven KPI ecosystem, measuring individual performance fairly, linking incentives to measurable outcomes, and giving management live operational visibility for the first time.
All 5 sample lines: operators, quality inspectors, supervisors, line leaders, and CAD (pattern and marker). Scope included role-based KPI structures, full ERP integration, PIB system design, and IoT data collection. Delivered by a 2-member core team.
- Replace line efficiency rankings with an Individual Hit Rate model accounting for sample complexity variation
- Deploy ERP-integrated real-time dashboards with 1-minute refresh and IoT-based data collection across all 5 lines
- Eliminate missing sample cases through stage-by-stage ERP sample movement tracking
- Implement a transparent, KPI-linked PIB system with role-based scoring across all staff categories
- Conduct 20 counseling sessions to build employee trust and drive adoption before go-live
Four sequential phases, each with locked deliverables and stakeholder sign-off before the next started. KPI logic was finalised before ERP development began. ERP was tested iteratively before go-live. PIB was confirmed by HR before the first live calculation.
Smartphone IoT apps capture production events per operator in real time, sync to the ERP, and the KPI engine calculates Hit Rate, DHU, DOT, and Fail Rate continuously. These feed the live dashboard and the monthly PIB model.
Each role category has KPIs aligned to its specific accountability. All weights and thresholds were signed off by IE, QA, and HR before ERP development started.
| Role Category | KPI | Weight | Design Rationale |
|---|---|---|---|
| Operators | Individual Hit Rate (%) | 80% | Replaces line efficiency. Complexity-adjusted target eliminates unfair penalty on operators assigned difficult styles. |
| Operators | Individual DHU | 20% | Operator-attributable defects only, externally caused defects excluded per IE–QA joint classification. |
| Quality Team | Sample Fail Rate · On-Time Inspection | Composite | Fail Rate tracks inspection accuracy; OTI prevents QA from becoming a delivery bottleneck. |
| Supervisors & Line Leaders | 5S · DOT · Line Hit Rate | Composite | Line Hit Rate aggregates operator output under each supervisor, accountability for team performance, not individual effort alone. |
| CAD — Pattern & Marker | Accuracy · Delivery on Time | Composite | Accuracy and DOT tracked per job, isolating accountability at individual level and eliminating downstream rework. |
Scored on a defined points scale so composite KPI scores are bounded and comparable across operators regardless of sample complexity assigned.
| Hit Rate Achieved | KPI Score (of 80 pts) | PIB Band Outcome |
|---|---|---|
| 100% | 80 | Exceptional. Full PIB + Performance Bonus |
| 90% | 70 | Exceptional. Full PIB + Performance Bonus |
| 80% | 60 | Above Target. Full PIB Eligible |
| 70% | 50 | Below Threshold. No PIB · Supervisor Review |
| 60% | 40 | Below Standard. No PIB · Supervisor Review |
| Below 60% | 0 | Below Standard. No PIB · Supervisor Review |
Weighted composite score (Hit Rate 80% + DHU 20%) maps to a monthly incentive band. Band assignment is automatic. Overrides require documented management approval, removing supervisor discretion from the incentive process.
Conflict: All staff categories resisted KPI monitoring, fearing it would penalize them or raise future targets. Operators had evidence for this skepticism, the existing line efficiency system had consistently disadvantaged those assigned complex styles.
BA Action: Conducted 20 floor-level counseling sessions in small groups. Demonstrated using baseline data that Individual Hit Rate produced fairer rankings than line efficiency. Showed PIB benefit numerically, higher scores meant higher bonuses, not higher targets.
Conflict: Early P-03 testing revealed synchronization latency, cross-department input inconsistencies, and KPI engine edge case failures. A big-bang go-live would have produced inaccurate PIB payouts before errors were correctable.
BA Action: Mandated iterative testing, no ERP module accepted until validated against defined test cases. Standardized data entry across Planning, IE, and QA before live testing began. Every edge case documented and resolved before live data entered the KPI engine.
Conflict: No formalized Time & Action structure existed at the sample process stage level. The system could confirm a sample entered and left the section, but could not identify where it stalled, making the 1,000 missing sample problem unsolvable without first solving the structural absence of stage accountability.
BA Action: Developed stage-based process tracking logic with IE and production management, defining each production step as a discrete, accountable ERP unit with a responsible role. Created the TNA structure as a KPI design requirement, not a separate initiative.
| Objective | Measured Impact | Status |
|---|---|---|
| Improve Delivery on Time | DOT: 91% → 95% | ACHIEVED |
| Eliminate missing sample cases | ~1,000/year → 0 | ACHIEVED |
| Fair individual KPI measurement | Efficiency +5% at go-live; +7% at 6-month post-implementation; operator score distribution normalized across complexity bands | ACHIEVED |
| Real-time operational visibility | After-shift reporting → live dashboard, 1-min refresh, all 5 lines | ACHIEVED |
| Reduce DHU | DHU: 400 → 340 units | ACHIEVED |
| Implement KPI-linked PIB | 100% calculation accuracy on first live cycle; adopted as authoritative PIB basis, delivered to HR via validated structured export (native payroll feed scoped for Phase 2) | ACHIEVED |
Gap 01 — TNA Not Fully Automated: Stage tracking is operational and missing sample incidents are eliminated. Several stages still use manual checkpoint logging. Full automation scoped as a Phase 2 ERP item pending IT capacity.
Gap 02 — PIB Not Natively in Payroll ERP: KPI scores auto-calculate in ERP; final PIB amounts are currently exported to HR as a structured report rather than a native payroll feed. Payroll integration is a documented Phase 2 workstream.
| Risk | Category | Likelihood · Impact | Mitigation | Outcome |
|---|---|---|---|---|
| Employee non-adoption causing inaccurate IoT data entry | People · Change | High · Critical | 20 pre-go-live counseling sessions; Hit Rate fairness demonstrated via baseline data; PIB benefit shown numerically | MATERIALIZED · RESOLVED — Normalized before first live cycle |
| KPI calculation error due to ERP sync failure affecting PIB pay | Technical · Data | Medium · Critical | Iterative P-03 testing; input standardized across departments; parallel-run cross-validation required | MITIGATED — 100% accuracy confirmed before go-live |
| IoT app reliability failure creating KPI data gaps | Technical · Infrastructure | Medium · High | Pre-go-live reliability testing across all 5 lines; fallback manual protocol defined | MITIGATED — Fallback invoked twice; no KPI impact |
| IE rejection of Individual Hit Rate model | Stakeholder · Scope | Medium · High | Hit Rate designed jointly with IE from P-02; IE sign-off embedded in design, not sought post-spec | MITIGATED — No objection after spec lock |
| ERP payroll integration delay blocking PIB automation | Delivery · Dependencies | High · Medium | Phased deployment architecture designed from initiation; HR export defined as interim handover | MITIGATED — PIB live on schedule; payroll on Phase 2 roadmap |
| Assumption | Owner | Status |
|---|---|---|
| IE production targets stable throughout the 4-month implementation | IE Team | VALIDATED — Target freeze committed at P-01 kickoff |
| IT delivers all ERP modules within agreed sprint cycles | IT Department | PARTIALLY INVALIDATED — Payroll module delayed; phased architecture absorbed the impact without affecting go-live |
| Employees participate in counseling sessions without line disruption | Production Management | VALIDATED — All 20 sessions completed in staggered groups; zero line disruption |
| QA auditors maintain consistent defect coding across all 5 lines | Quality Assurance | VALIDATED — IoT DHU correlated within acceptable variance against QA audit records |
| HR co-owns PIB band structure and signs off before first live cycle | HR Department | VALIDATED — Formal HR sign-off obtained before first cycle processed |
- Budget: No external software budget. All infrastructure built within the existing in-house ERP, driving the phased payroll integration architecture (Gap 02).
- Timeline: 4-month fixed window aligned to the HR incentive cycle. No slack for fundamental rework after testing.
- Team: 2-member core team managing all cross-functional coordination across IE, IT, QA, Planning, and CAD. Non-essential features deferred to Phase 2.
- Literacy: All operator-facing materials and IoT interfaces designed for varying literacy levels; translated where required before training.
- IT capacity: ERP development shared across concurrent projects. Phased deployment architecture was a design necessity, not a preference.