Open to Roles · BA · CI Manager · KPI Systems · Digital Transformation · Industry 4.0

Tonmoy
Paul

Turning Factory Operations Into Managed, Measured Performance

I design the measurement infrastructure that turns factory operations into managed, data-driven performance — IoT, ERP integration, QR traceability, predictive analytics.

14+
Operational intelligence systems delivered
8+
Process optimization initiatives
70%
Manual reporting eliminated
$60M+
Yearly cost exposure monitored
Tonmoy Paul
Dhaka, Bangladesh
Open to Remote & On-site
Snowtex Group
CI & Digitalization · Jan 2024–Present
About Me

From the Factory Floor
to the BA Role

Industrial engineer by training. Business analyst by practice. Digital transformation practitioner by delivery. All three, simultaneously, across 14 live systems in 2.5 years.

I diagnose operational problems on the factory floor, define what needs to be built through structured requirements engineering, and deliver the analytical systems that prove the improvement is real. At Snowtex Group, that meant 8 end-to-end projects spanning process redesign, digital transformation, and predictive analytics — from OEE improvement and Value Stream Mapping through BRD documentation, stakeholder sign-off, and UAT, to predictive modelling achieving 90.1% forecast accuracy. The result: 70% less manual reporting, $60M+ in yearly cost exposure under centralized monitoring, and systems that run without me.

Each project began with a discovery phase calibrated to its context — floor observation and operator interviews for production systems, stakeholder workshops for cross-departmental KPI conflicts, data audits for cost and analytics projects. The method changed. The discipline of understanding the problem before designing a solution did not. The root cause was never just 'no dashboard'. It was structural: cost and production data in silos, KPI definitions disputed between departments, manual systems that could not scale. Resolving those conflicts through formal requirements sign-off, not assumptions, is what separates a BA solution from a reporting tool that gets ignored.

Requirements GatheringStakeholder ManagementKPI Framework DesignProcess MappingOEE ImplementationLean & CIDMAICVSMData VisualizationPredictive AnalyticsReporting AutomationBusiness Process ImprovementRoot Cause AnalysisERP Business AnalysisGoogle Data StudioExcel AnalyticsManufacturing AnalyticsIndustry 4.0 SystemsDigital TransformationMIS & Operational ReportingIoT System Design
My Approach
01
Discovery & ElicitationDiscovery method calibrated to context — DMAIC Define & Measure phases for process improvement projects, floor observation and operator interviews for production systems, cross-functional workshops for KPI disputes, data audits for analytics and cost projects. Method varies. Rigour does not.
02
Requirements SpecificationDocument functional requirements with acceptance criteria, process maps where applicable, and a risk register. Every assumption is written down and signed off before build starts.
03
Stakeholder AlignmentSurface KPI disputes, departmental conflicts, and trust gaps early. Resolve them through structured sessions — documented, not assumed away.
04
Solution Design & DeliveryArchitect the data model, reporting system, and automation layer. Built to be handed over and run independently — not to require ongoing BA involvement.
05
UAT, Measurement & HandoverValidate against agreed acceptance criteria, quantify the baseline-to-outcome change, and ensure the system runs without me.
Business Value

What I Deliver

Five things I do well, each backed by real projects and measurable results.

KPI Systems That Stick
I design measurement frameworks stakeholders actually use, not dashboards that get opened once and ignored.
Eliminating Manual Reporting
I find every spreadsheet being emailed on a Friday and replace it with something automated, accurate, and real-time.
Translating Data into Decisions
I turn raw operational numbers into clear narratives, the kind that make it obvious what to do next.
Winning Over Resistant Stakeholders
Cutting leaders who feared transparency. Operators suspicious of PIB. HR with no data to defend decisions. I've brought them all on board.
Finding What's Actually Wrong
I don't just report the numbers. I diagnose why they're off and structure a path to fix it.
Process Improvement That's Measurable
I don't stop at identifying the problem. I redesign the process, build the measurement system, and track the improvement until it's proven in production data — not just reported once.
Project Portfolio

Other Projects

Additional initiatives demonstrating cross-functional operational impact.
MIS
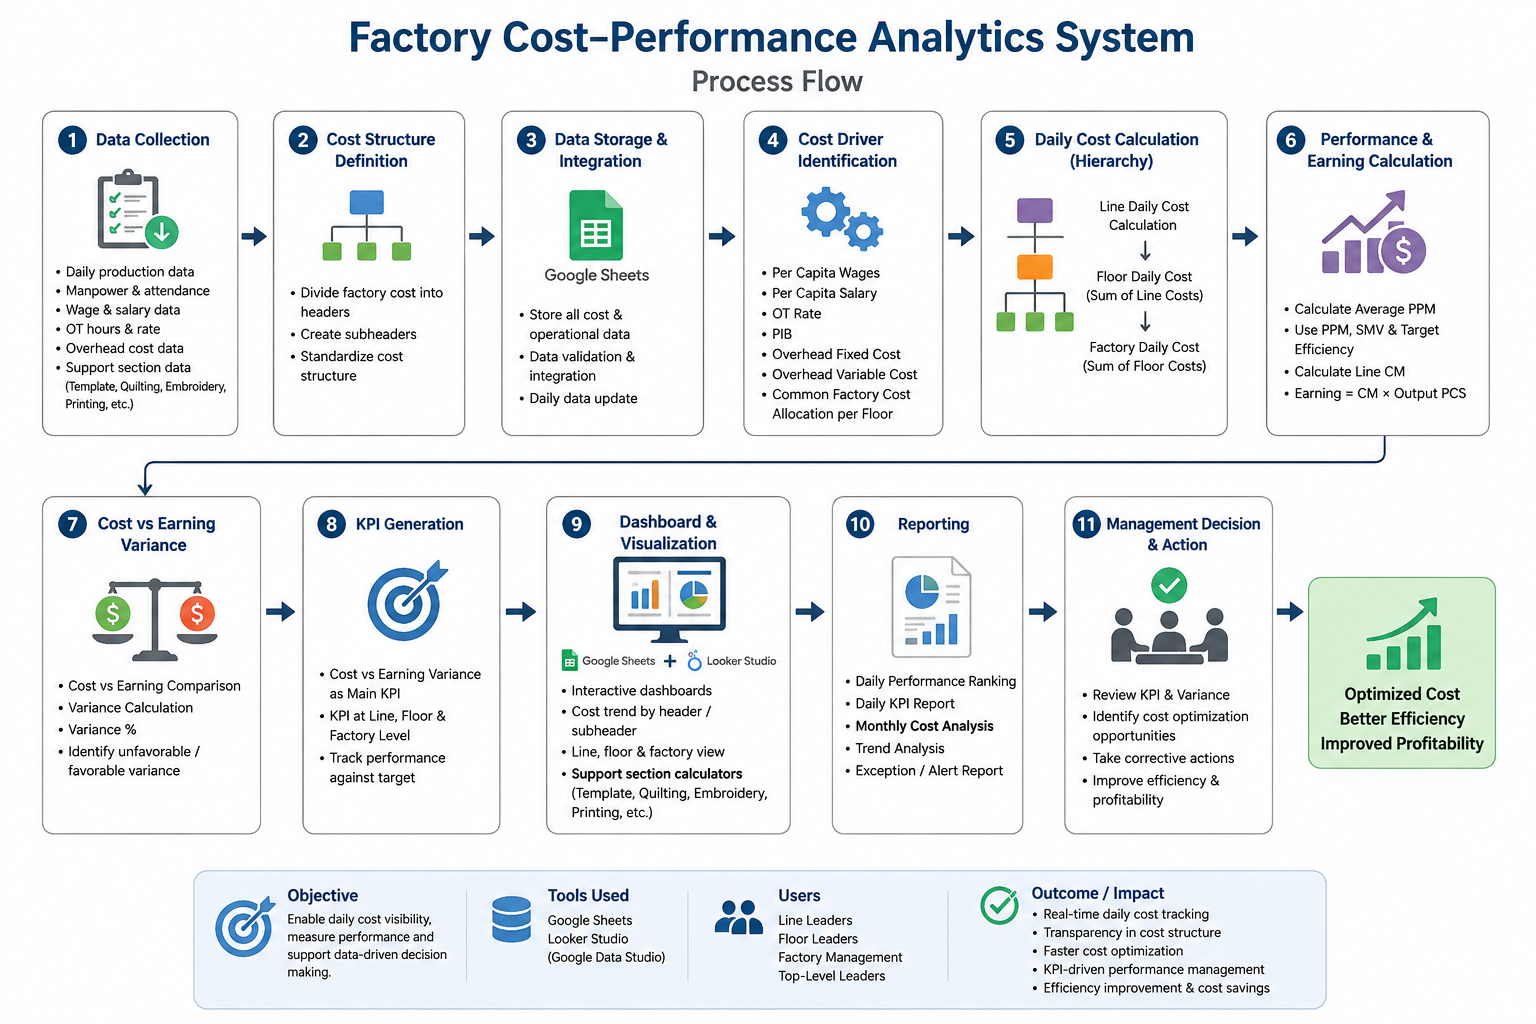
Factory Cost-Performance Analytics System
MIS & operations analytics — daily cost-performance visibility across line, floor, and factory levels
Google SheetsGoogle Data StudioCost AnalyticsFinancial ModelingPerformance Dashboards
BA Artifacts:BRDProcess MapsAs-Is/To-BeUATNFR
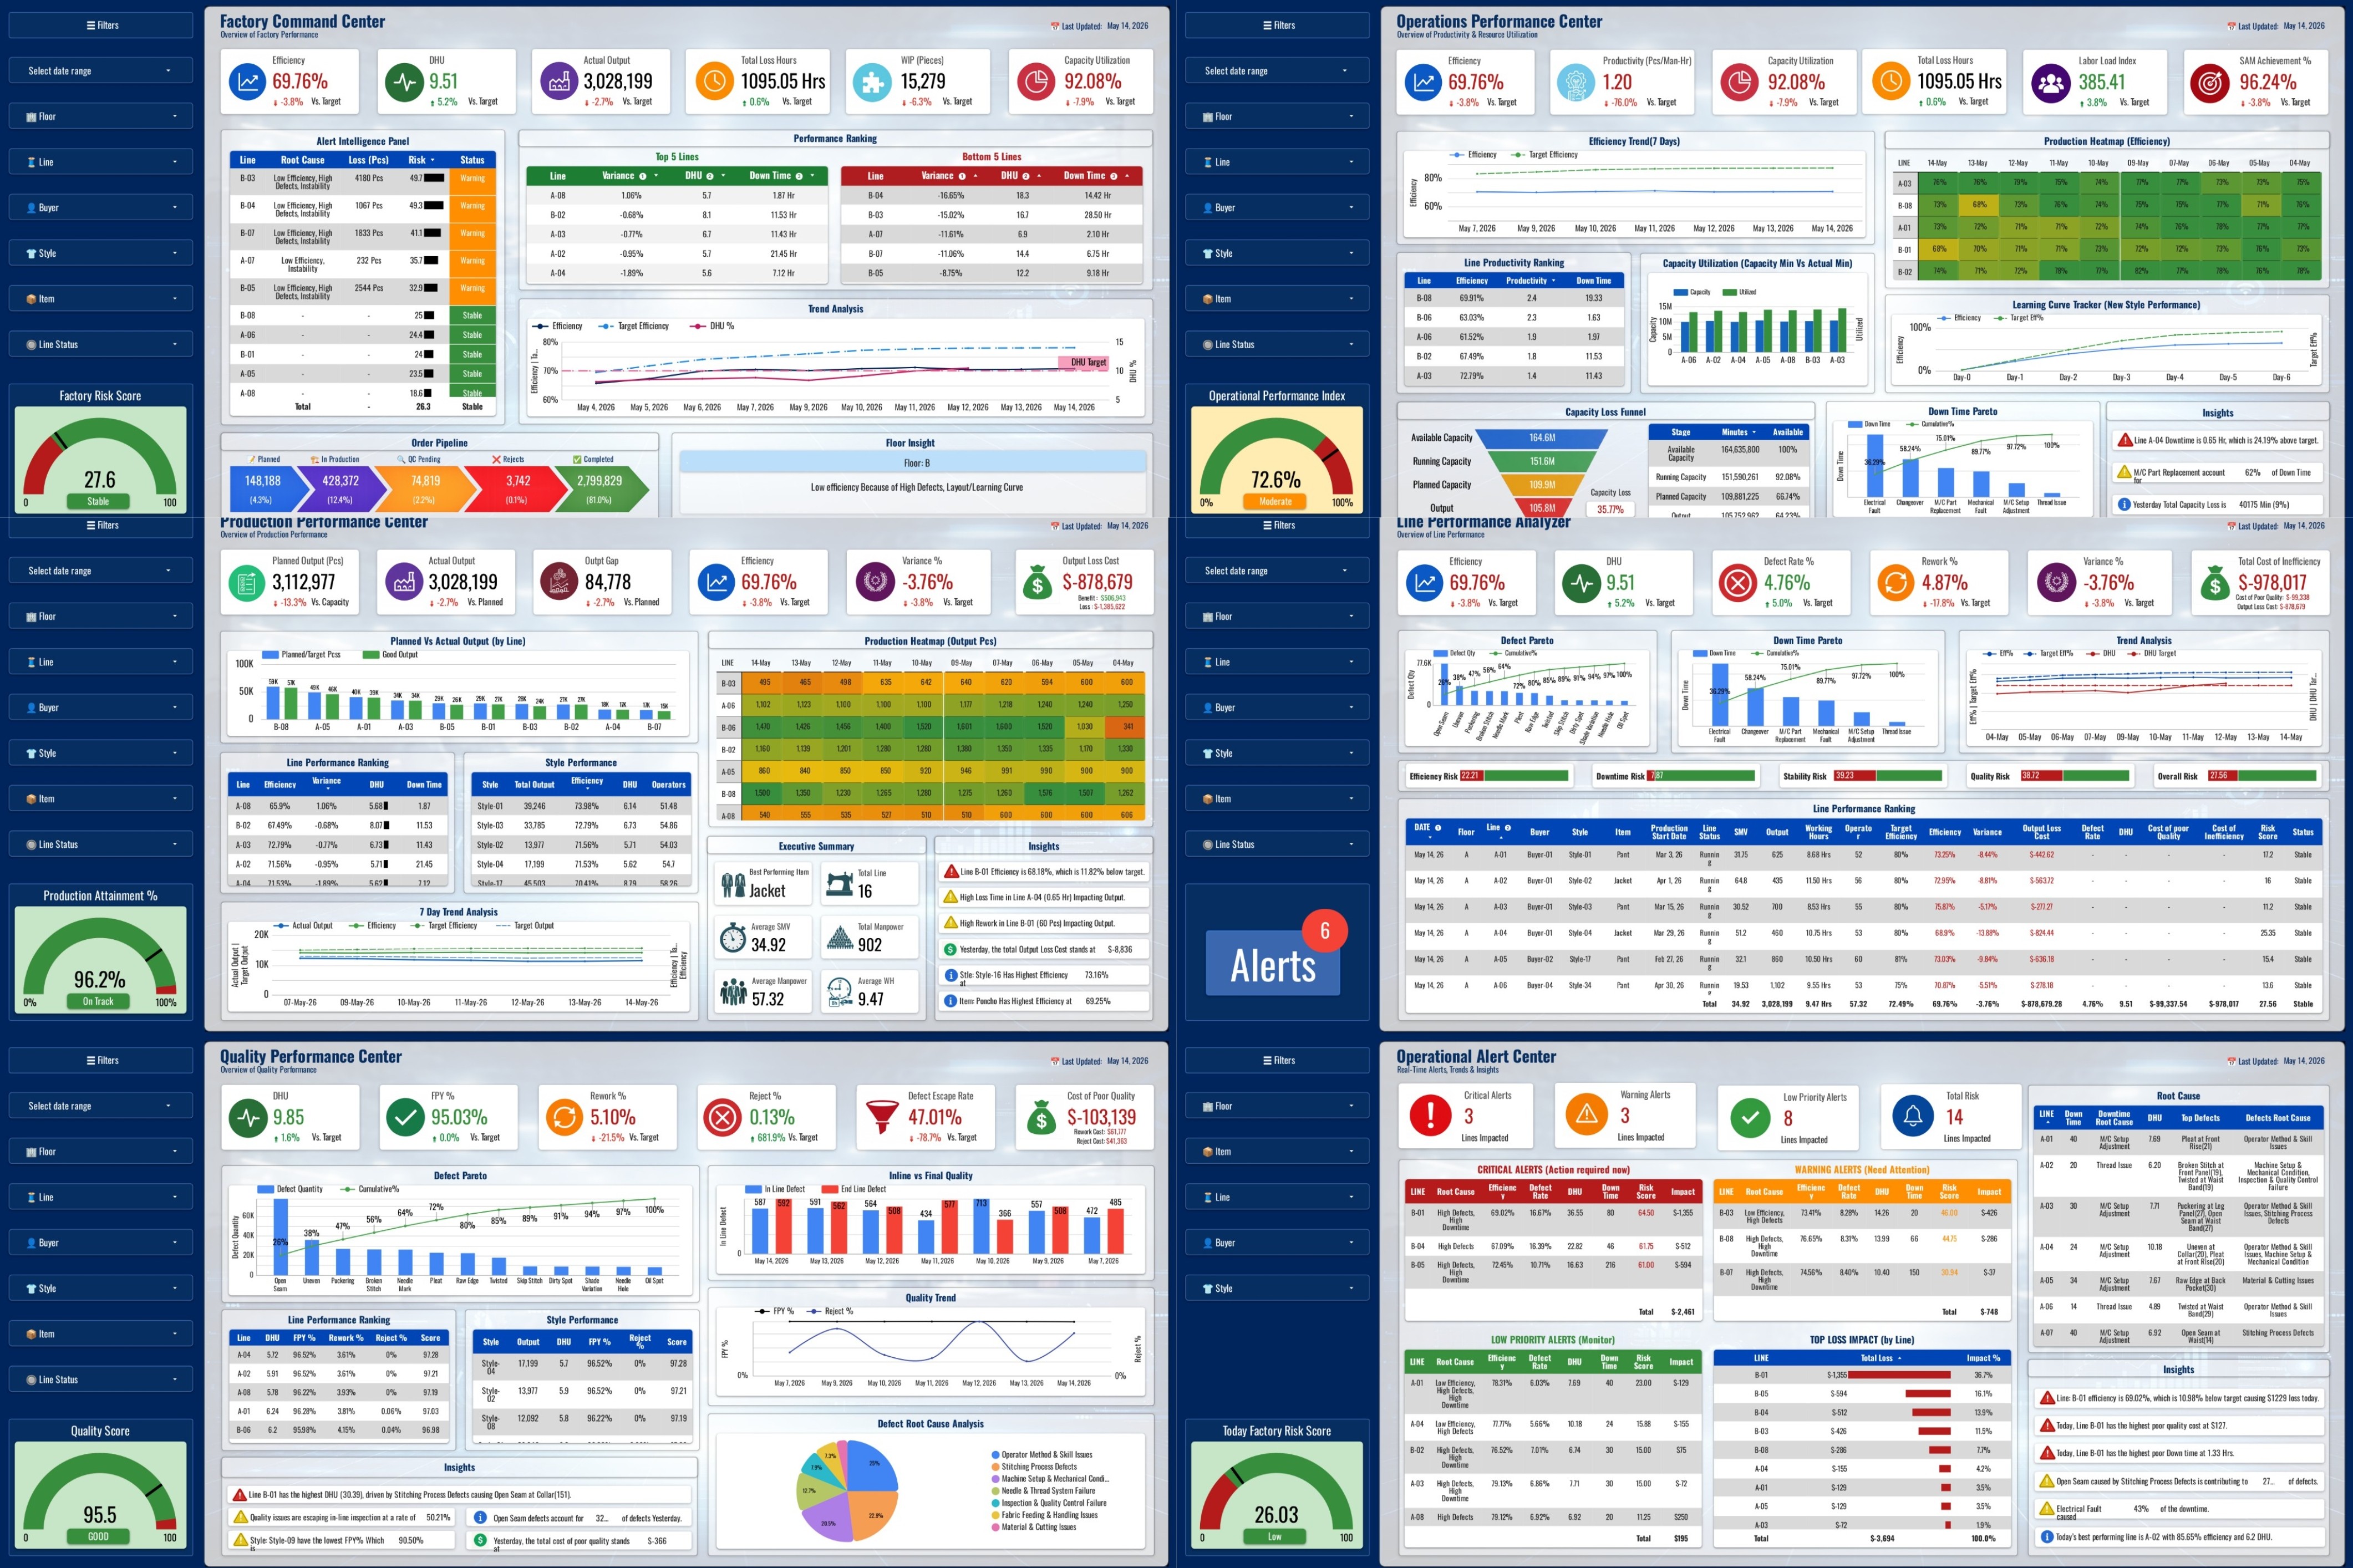
Factory Cost-Performance Analytics System project screenshot
Project Overview

Conducted structured elicitation with Finance and Operations to expose the root cause: cost and production data in structural silos, making line-level cost efficiency measurement impossible. Resolved a 10–18% divergence between Finance and Operations figures through a joint cost structure sign-off before build. Delivered a daily cost-performance analytics system connecting operational KPIs to financial impact across 3 reporting levels.
Key Outcomes
Cut decision lag from an 18-day average (sometimes 25) to zero — management could see same-day CVE per line instead of waiting for the monthly close
Month-end financial close compressed from 2-3 days to same-day; Finance reporting effort down ≥60%, self-reported by the Finance Lead across three post-go-live cycles
Automated 81 cost heads across all lines, floors, and factory under a $60M+ yearly cost base, with 8 cost drivers tracked per line daily
Eliminated the 10-18% divergence between Finance and Operations cost figures by getting both sides to sign off a single cost structure before the build started
Individual Performance Evaluation
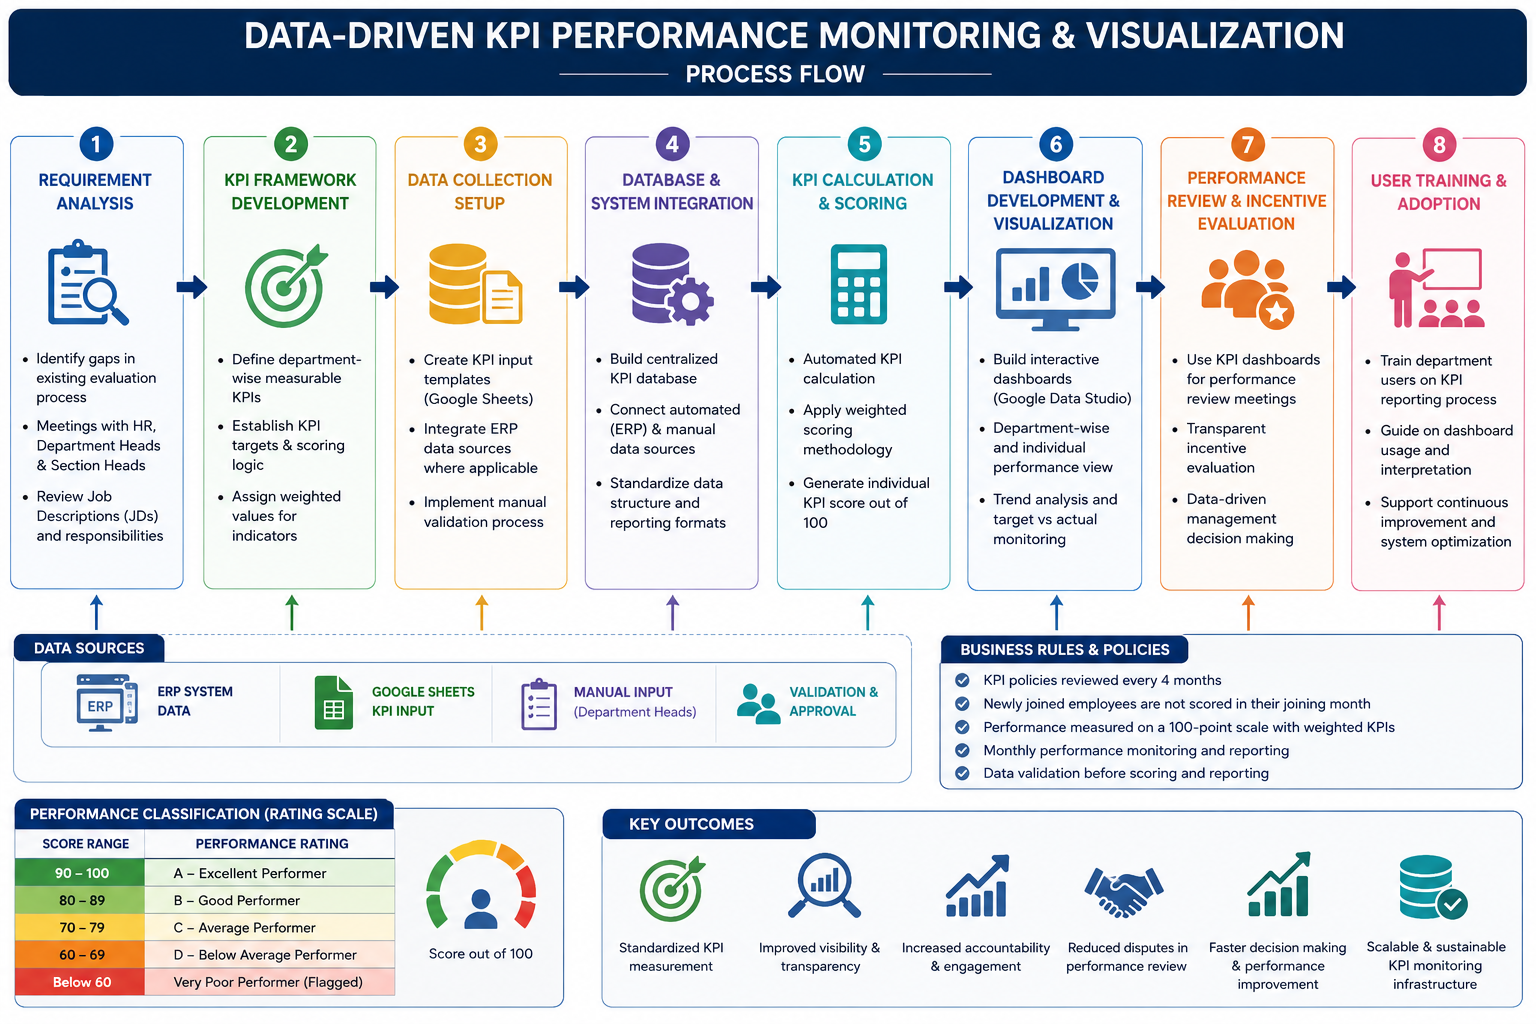
Data-Driven KPI Performance Monitoring & Visualization
Multi-stakeholder KPI framework resolving cross-department performance data conflicts
Google SheetsGoogle Data StudioKPI DesignPerformance AnalyticsData Visualization
BA Artifacts:BRDRTMUATRACI
Data-Driven KPI Performance Monitoring & Visualization project screenshot
Project Overview

Elicited KPI requirements across 24 departments and 77 sections through structured stakeholder sessions, designing role-specific indicators where no measurement standard existed. Resolved a multi-session Budget vs Realization conflict that had blocked alignment across all 24 department heads. Delivered a standardized 100-point scoring framework with automated dashboards replacing subjective supervisor reviews.
Key Outcomes
Rolled out a 100-point KPI scoring framework across 24 departments and 77 sections, covering 2,000+ employees — all on the same standardized scale for the first time
Resolved a multi-session Budget vs Realization conflict: all 24 department heads eventually accepted the indicator, closing the longest-running alignment dispute in the project
Replaced subjective supervisor reviews with weighted, automated KPI scores, removing the scoring inconsistency that had made cross-department comparisons meaningless
Gave management a single performance language across the entire non-production workforce, with every department scored on the same logic and the same 100-point rubric
Industry 4.0
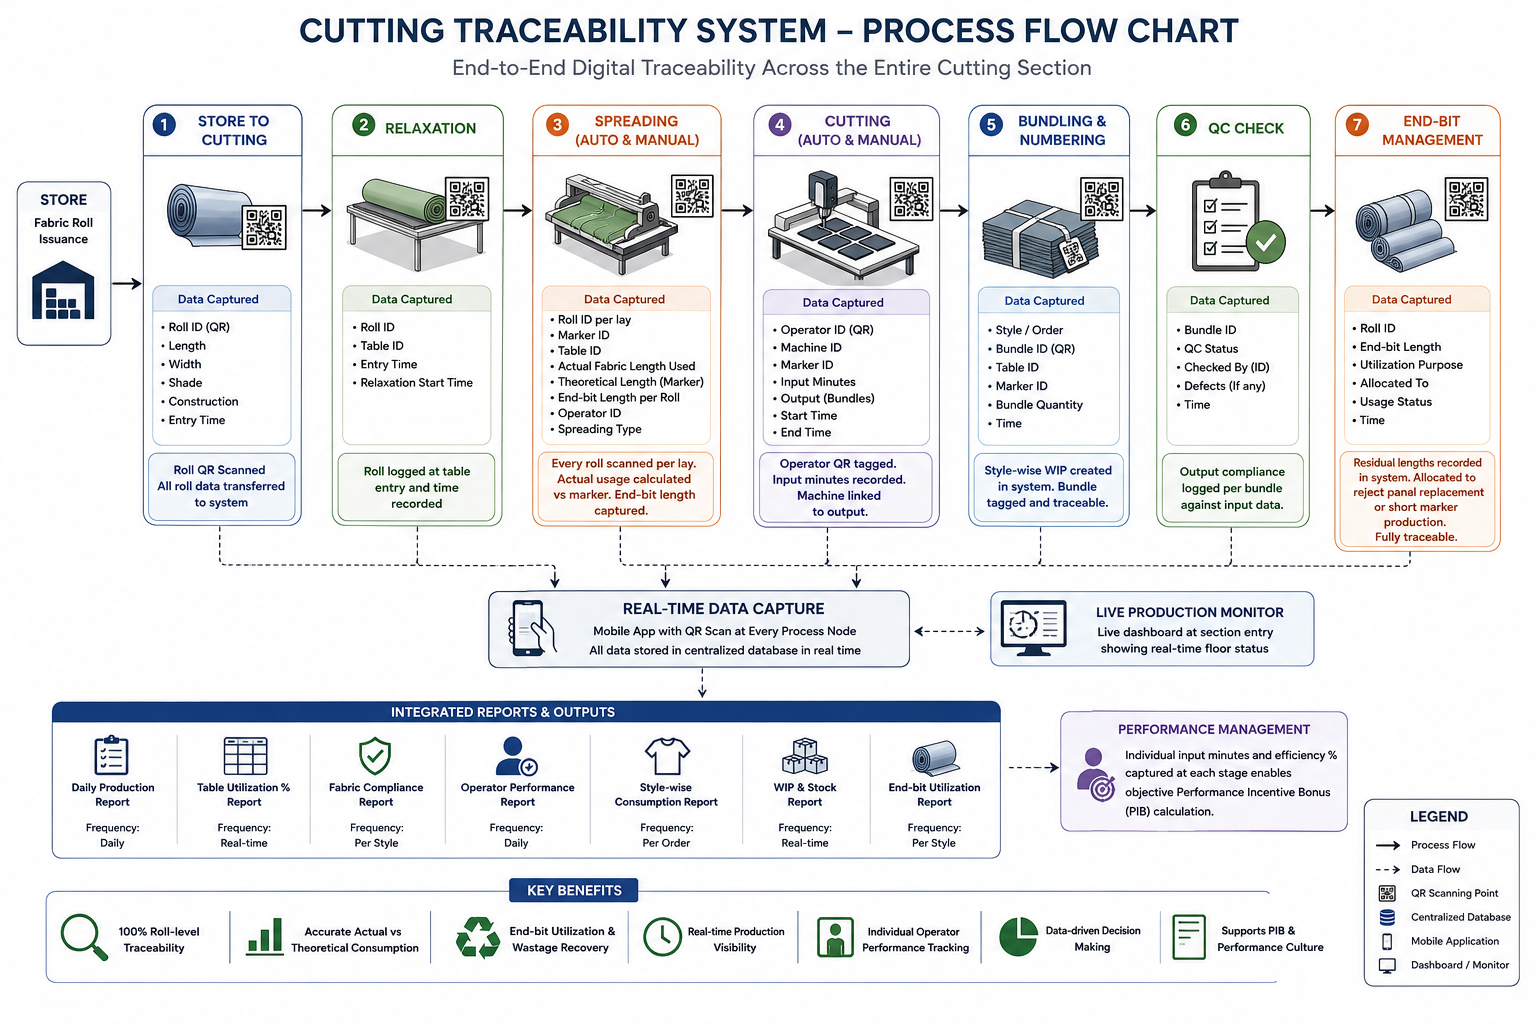
Cutting Traceability System
End-to-end process traceability replacing manual tracking — 11 floors, 2 factories, 7 automated reports
QR Code SystemsMobile ApplicationCentralized DatabaseReal-Time DashboardsERP Integration & RequirementsGoogle Sheets
BA Artifacts:BRDProcess MapsRTMUAT
Cutting Traceability System project screenshot
Project Overview

Conducted process discovery across 11 cutting floors to map the As-Is state — manual tracking, zero roll-level accountability, no fabric consumption visibility against CAD markers. Gained buy-in from initially resistant floor teams through structured pilot demonstration before full deployment. Delivered end-to-end QR-based traceability across 2 factories with 7 automated management reports.
Key Outcomes
Achieved full roll-level traceability from fabric store receipt through all 6 cutting stages across 2 factories and 11 floors
Automated all 7 management reports — eliminating manual consolidation and providing instant operational visibility
Established objective operator productivity tracking as the data foundation for PIB (Performance Incentive Bonus) calculation
Enabled real-time fabric consumption visibility against CAD marker requirements and structured end-bit accountability
Decathlon OWE Intelligence System
OWE Digital Transformation & Predictive Early Alert System
Predictive analytics system achieving 90.1% forecast accuracy — weekly analysis effort cut by 88%
Google SheetsGoogle Apps ScriptGoogle Data StudioGemini APIPredictive ModellingKPI Analytics
BA Artifacts:BRDRTMRACIRisk RegisterNFRElicitation Method
OWE Digital Transformation & Predictive Early Alert System project screenshot
Project Overview

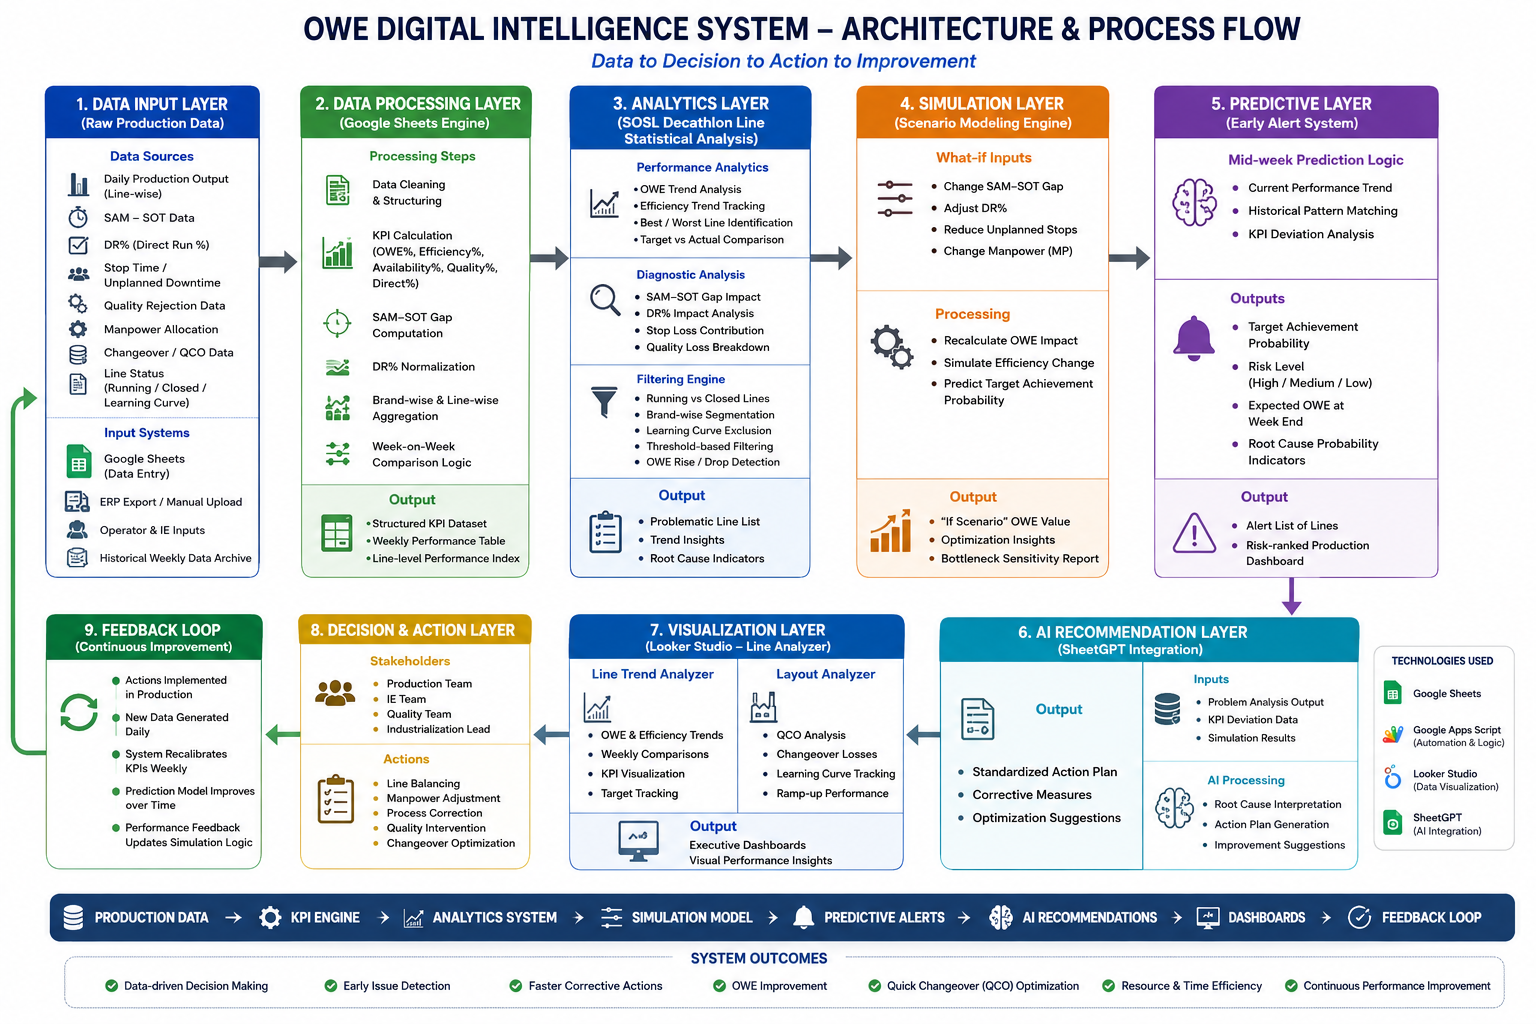
Built a predictive OWE intelligence ecosystem for 62 Decathlon production lines — achieving 90.1% forecast accuracy through a multi-layer analytical engine combining Google Sheets modelling with Gemini API-powered action recommendations. Diagnosed the absence of structured data infrastructure and retrospective-only reporting as the root cause of performance blind spots. Defined all requirements including algorithm logic, alert thresholds, and reporting structure from weekly Decathlon Sum meetings. Contributed to Snowtex achieving OPEX Level-B (73%) — first Decathlon supplier in Bangladesh. Recognised by name in Decathlon's Certificate of Appreciation.
Key Outcomes
Improved OWE from 60% to 70% across 62 Decathlon production lines (+10pp gain from W27 2024 through 2025 YTD)
Achieved 90.1% prediction accuracy with the mid-week Early Alert Model, enabling timely intervention before week-end OWE is locked
Reduced weekly analysis effort by ~88% — from 96 person-hours (3 analysts) down to ~12 person-hours (2 analysts)
Cut daily analysis time from 8 hours to 1 hour per person, freeing analytical bandwidth for strategic work
Additional Projects
Industry 4.0
IoT-Driven Production & KPI-Based Incentive System
Industry 4.0 IoT deployment — real-time production monitoring and transparent incentive system across 172 lines
IoTKPI AnalyticsERP Integration & RequirementsReal-Time DashboardsGoogle SheetsGoogle Data Studio
BA Artifacts:BRDProcess MapsRTMUATNFR
IoT-Driven Production & KPI-Based Incentive System project screenshot
Project Overview

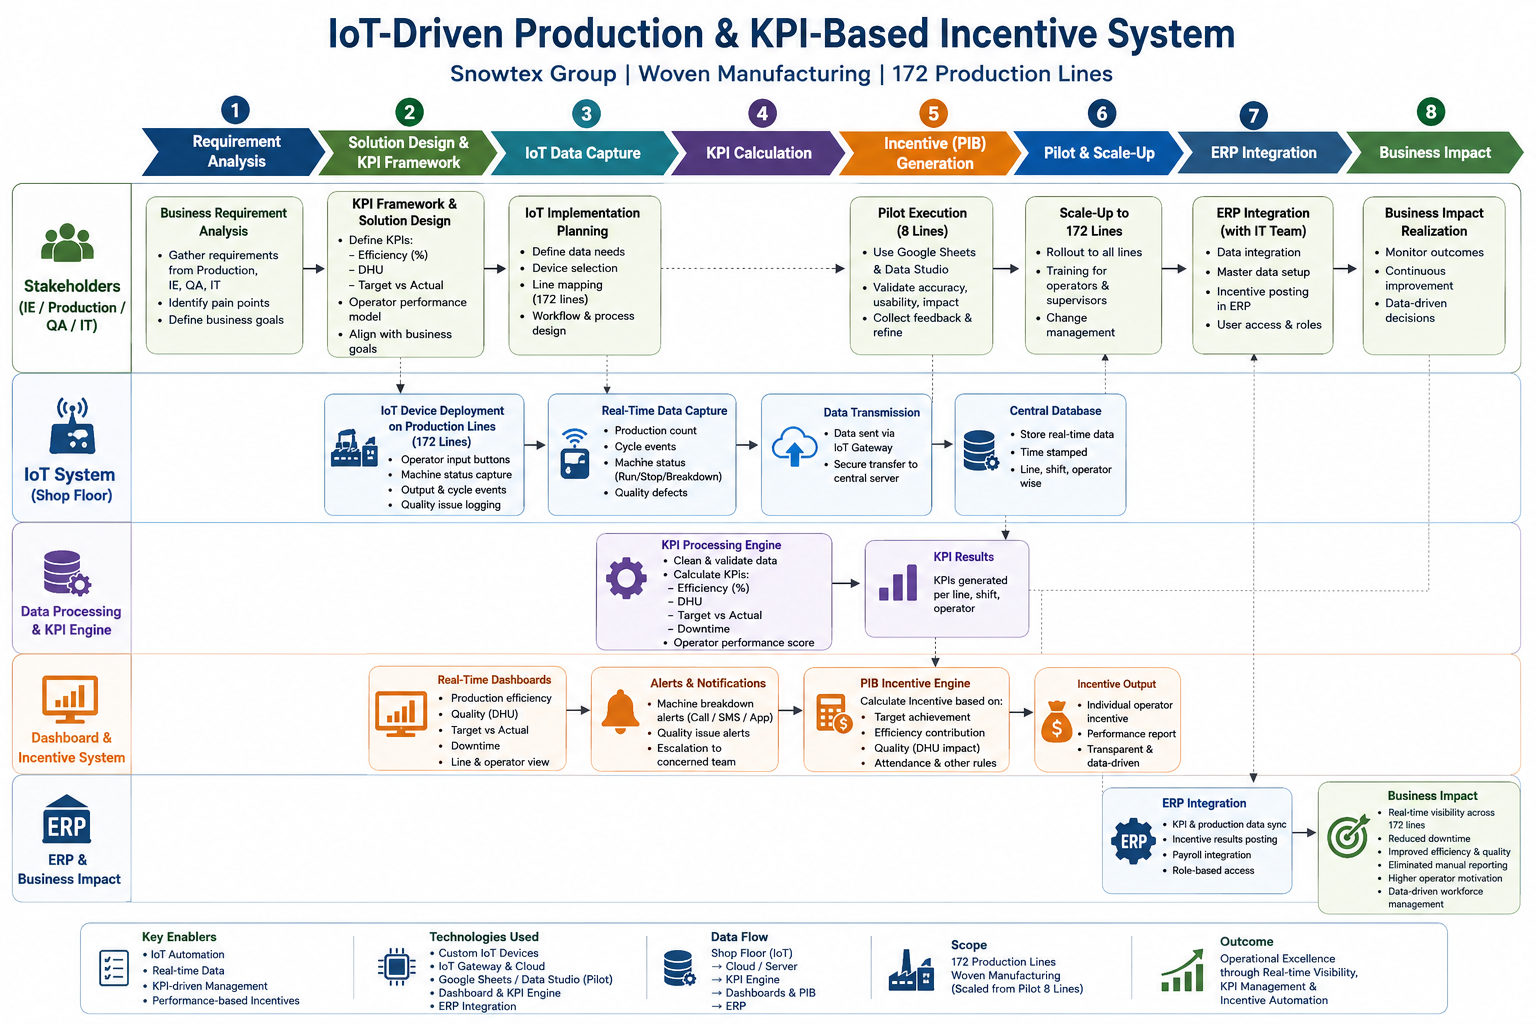
Elicited requirements for a pay-linked incentive system from three stakeholder groups with conflicting interests — operators fearing monitoring, supervisors protecting discretionary control, and management needing cost accountability. Resolved all three conflicts through structured sessions before build. Delivered an IoT production monitoring system with a transparent PIB model, piloted on 8 lines and scaled to 172.
Key Outcomes
Average line efficiency up 15% within 6 months of full deployment — in woven manufacturing, where 1-2% gains are operationally significant
Replaced manual tally sheets and shift-end reporting across all 172 lines with real-time IoT data capture, eliminating the daily reporting lag entirely
Validated the PIB model on 8 pilot lines before scaling — including one parallel cycle cross-checked against the legacy process to catch any calculation errors before they hit 172 operators' pay
Scaled from pilot to factory-wide without a payroll incident; ERP integration followed once the live system had proven stable at full deployment
Inventory accuracy improved
QR-Based Fabric Store Management System
Digital inventory management system eliminating manual bin card tracking and automating GRN verification
QR Code SystemsMobile App IntegrationERP Integration & RequirementsInventory Analytics
BA Artifacts:BRDProcess MapsUATRisk Register
QR-Based Fabric Store Management System project screenshot
Project Overview

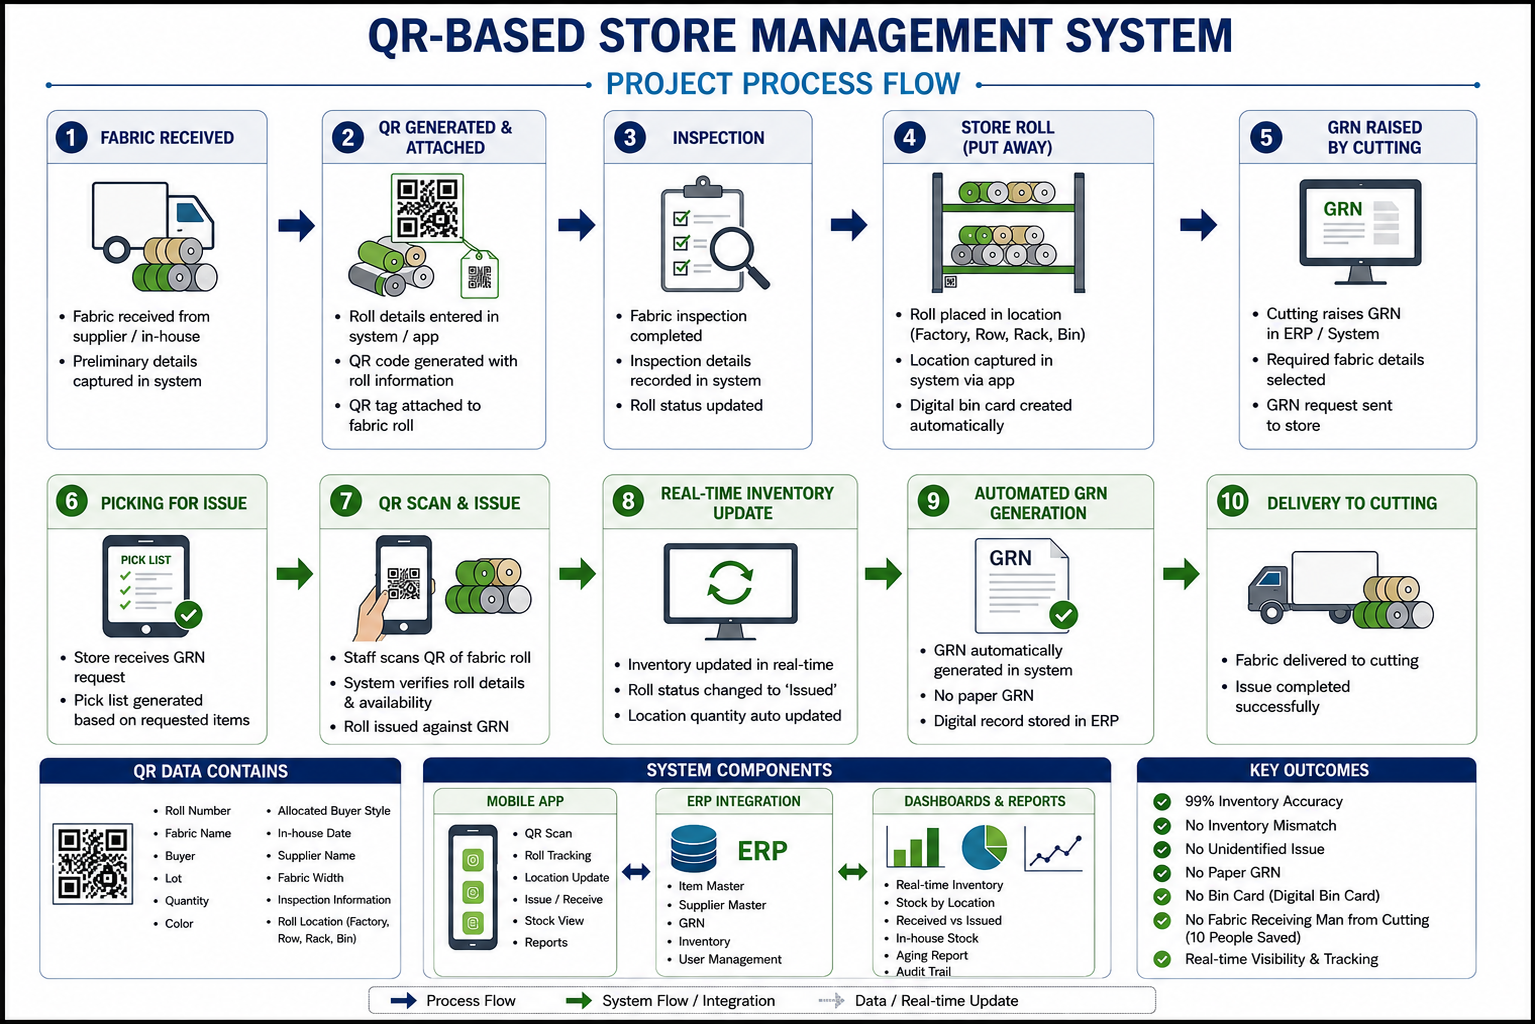
Mapped the As-Is warehouse process across 4 facilities — paper bin cards, manual GRN generation, and 75% inventory accuracy — and elicited requirements from warehouse staff, Finance, and production planning. Delivered a QR-based system integrating mobile application, ERP, and automated GRN generation with a 1 BA, 2 developer team over 6 months.
Key Outcomes
Inventory accuracy went from 75% to 99% within 6 months across 4 warehouses — a 24-point gain driven by scan-verified receipt, placement, and issue at roll level
GRN processing time cut from ~30 minutes to ~5 minutes per transaction (83% faster), with paper GRNs replaced by automated scan-at-issue generation
Replaced 6,000 annual paper bin cards with real-time digital records; roll mismatches that were previously routine became structurally impossible
Freed 11 staff from manual GRN reception and bin card maintenance for redeployment elsewhere — headcount savings without a single redundancy
Sample Section Transformation
KPI Digitalization and Effective PIB implementation (Sample Section)
ERP-integrated individual performance management system with live dashboards and objective incentive calculation
ERP Integration & RequirementsGoogle SheetsDigital Display BoardsKPI AnalyticsPerformance Management
BA Artifacts:BRDRTMRACIRisk RegisterStakeholder Register
KPI Digitalization and Effective PIB implementation (Sample Section) project screenshot
Project Overview

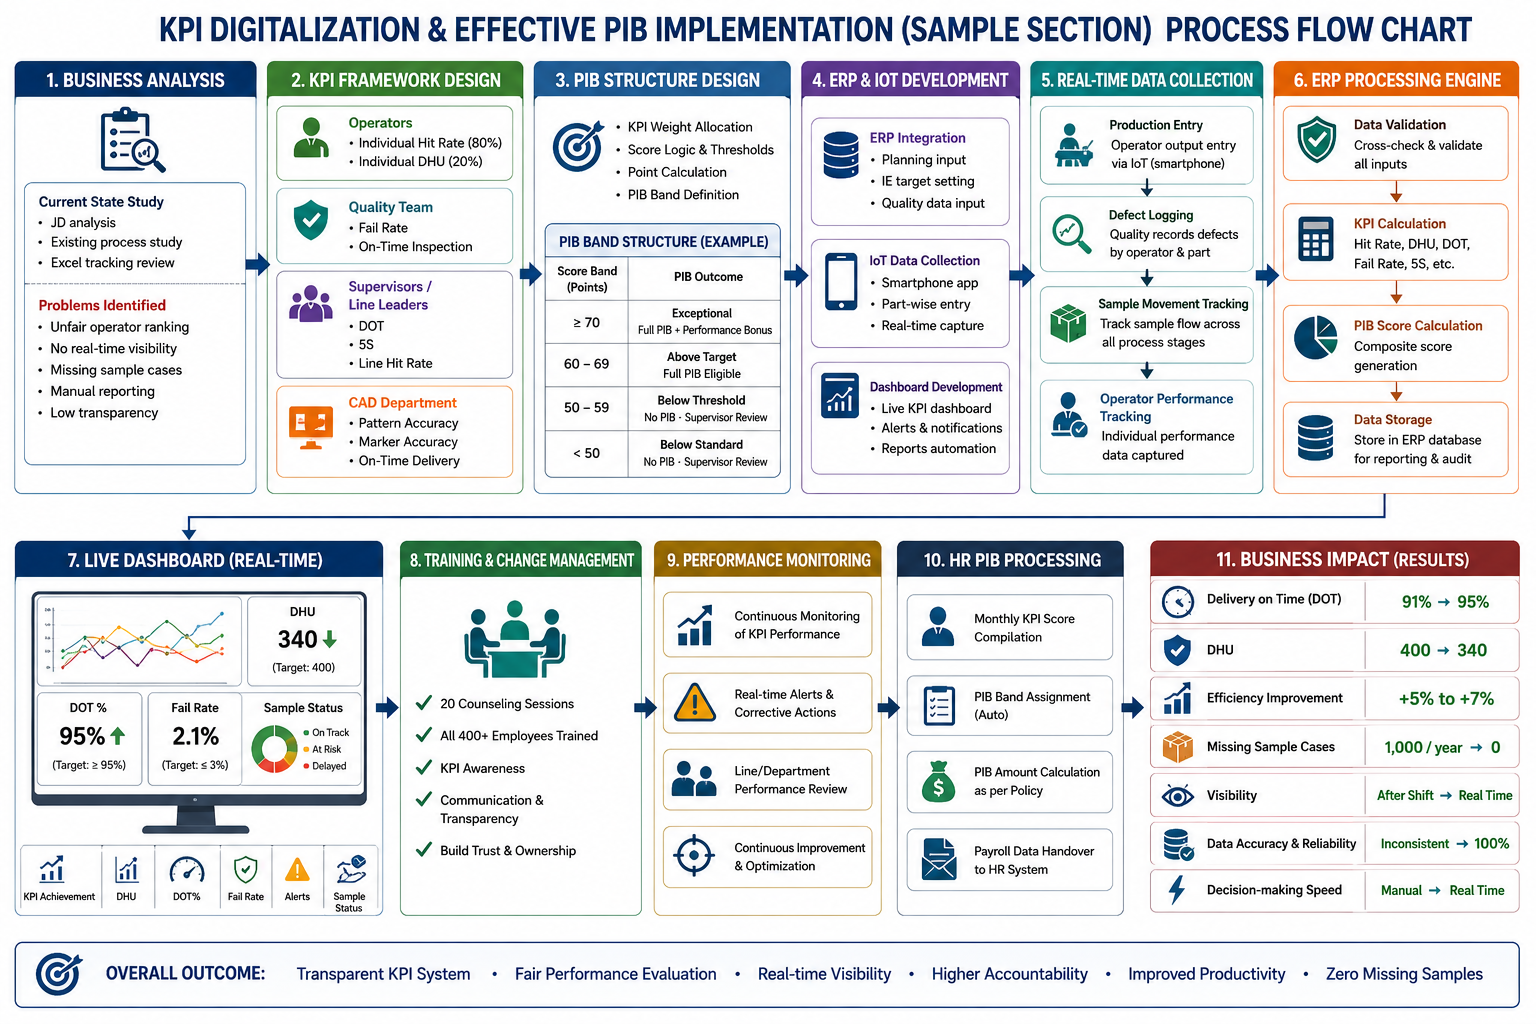
Elicited role-based KPI requirements for 5 operator categories across the sample section, designing individual measurement frameworks where none existed. Resolved a missing sample accountability conflict before go-live that had been generating ~1,000 annual cases. Delivered an ERP-integrated KPI and PIB system covering 400+ employees with live digital display boards.
Key Outcomes
DOT improved from 91% to 95%, and missing sample cases dropped from ~1,000 per year to zero — both tracked at 4 months post go-live
Line efficiency up +5% at go-live, +7% at the 6-month mark; DHU fell from 400 to 340 as operator-level attribution made defect ownership visible for the first time
PIB ran at 100% calculation accuracy on the first cycle and was adopted by HR as the authoritative incentive basis — no manual reconciliation, no disputes
Brought 400+ employees across 5 lines under individual KPI measurement in 4 months, replacing subjective supervisor scoring with role-weighted, ERP-driven data
24-point OEE gain over 12 months
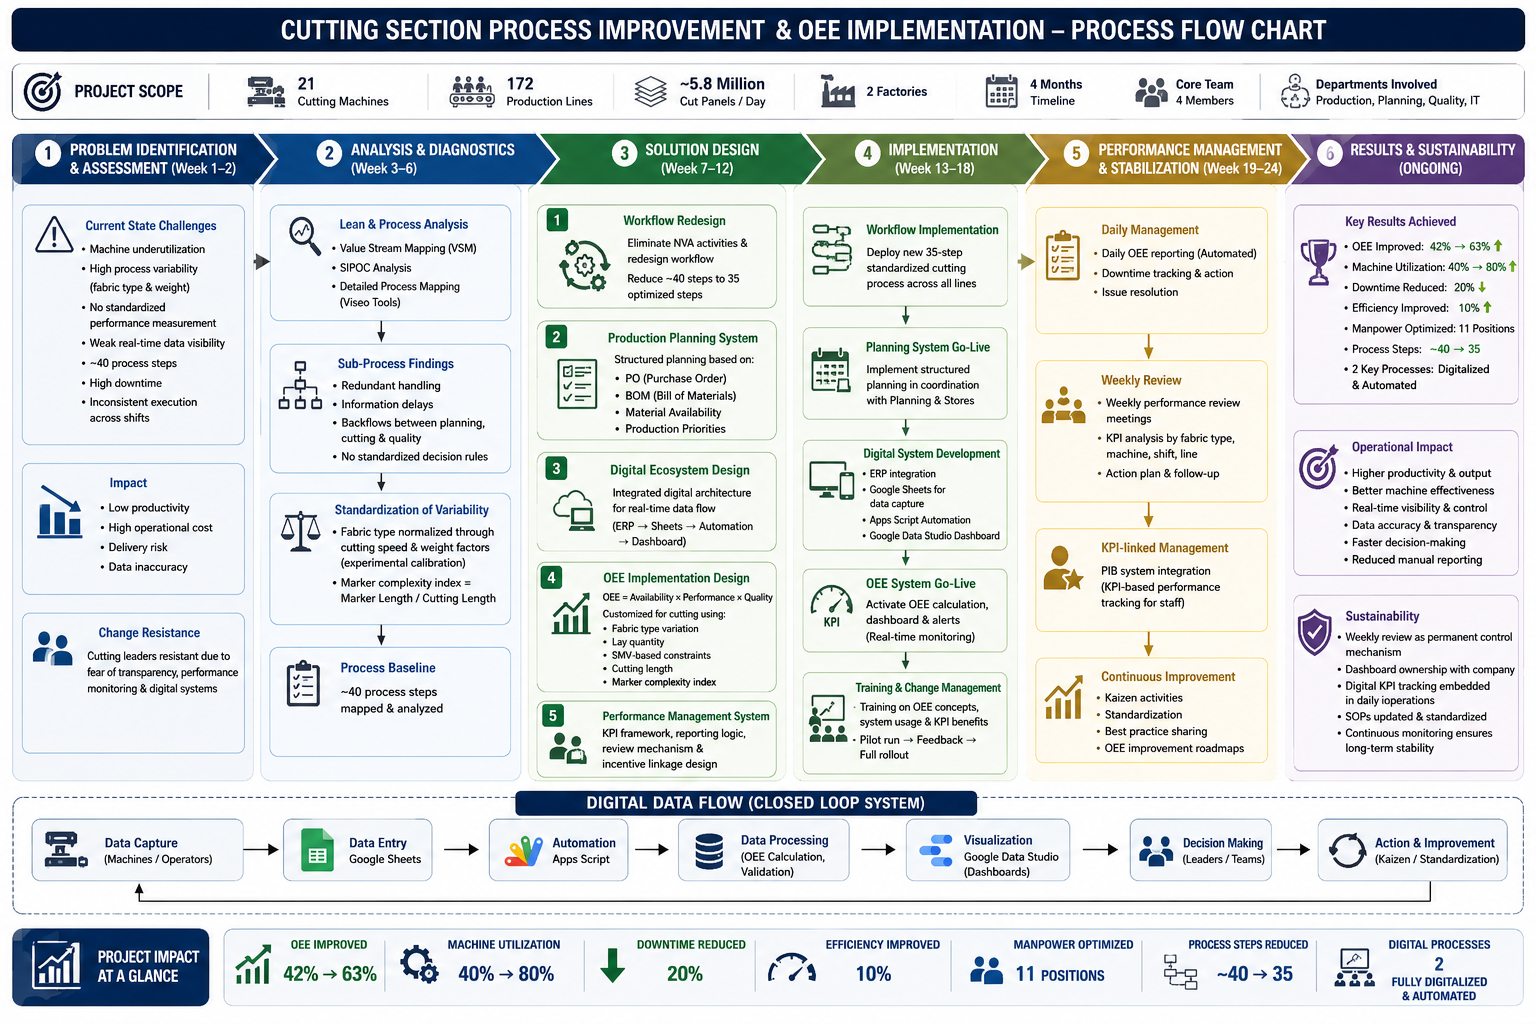
Cutting Section Process Improvement & OEE Implementation
Root cause-driven process improvement delivering a 24-point efficiency gain over 12 months
Value Stream MappingOEE FrameworkGoogle SheetsGoogle Apps ScriptGoogle Data StudioLean Manufacturing
BA Artifacts:BRDVSMSIPOCProcess MapsRTMUATRACIRisk Register
Cutting Section Process Improvement & OEE Implementation project screenshot
Project Overview

Applied Value Stream Mapping and root cause analysis to diagnose a cutting section stagnating at 42% OEE — a 40-step workflow with no measurement framework, zero data capture, and 40% machine utilization. Redesigned the entire process using SIPOC-based workflow restructuring, implemented a 21-machine OEE measurement system, and built a digital monitoring ecosystem that replaced all manual tracking. Overcame cutting leader resistance through pilot demonstration and data-backed benchmarking before full deployment. Result: OEE 42%→66%, machine utilization 40%→80%, 22 positions reallocated without output loss.

Key Outcomes
OEE climbed from 42% to 63% within 6 months, then to 66% at the 12-month mark — clearing the target band (65-74%) within one year of go-live
Machine utilization doubled from 40% to 80% within 6 months; total machine downtime dropped 20% in the same window
Reallocated 22 manual cutter positions across 11 floors without any output loss — headcount reduction achieved through workflow redesign, not cuts
Workflow redesign trimmed the cutting process from ~40 steps to 35, eliminating 5 non-value-adding steps identified during VSM and floor observation
Core Competencies

Skills & Expertise

BA skills backed by deep manufacturing domain knowledge. Every item here is evidenced by a real project.

Business Analysis
17 skills
Requirements ElicitationBRD / RTM DocumentationFunctional Requirements SpecificationUATGap AnalysisScope Definition & ManagementStakeholder ManagementKPI Framework DesignRoot Cause AnalysisAs-Is / To-Be AnalysisProcess & Swimlane MappingDashboard Design & ArchitectureRequirements TraceabilityIncentive System DesignBenefits Realization & Impact MeasurementPilot Testing & ValidationStakeholder Adoption Management
Continuous Improvement & Lean
8 skills
OEE ImplementationValue Stream Mapping (VSM)SIPOC AnalysisDMAIC MethodologyGEMBA-Based DiscoveryLean Waste EliminationProcess Baseline & Target SettingKaizen Design
Data & Analytics
8 skills
Predictive ModellingStatistical Process ControlIQR Anomaly DetectionTrend & Variance AnalysisFinancial ModellingWorkflow Automation DesignAI-Assisted Decision Support IntegrationERP Data Integration
Manufacturing Domain
9 skills
Garment Production OperationsOEE & Cost-Performance AnalyticsCutting & Fabric TraceabilityIoT Production MonitoringWarehouse & Inventory SystemsDecathlon OPEX / IndustrializationPIB & Incentive StructuresIndustry 4.0 / Smart Factory SystemsMIS & Operational Reporting
Tools & Technologies
8 skills
Google Data StudioAdvanced Excel & Google SheetsGoogle Apps ScriptERP Integration (Requirements & UAT)IoT & QR SystemsVisio / Draw.ioSQLPower BI
Career Timeline

Experience

Snowtex Group
Assistant Manager — Continuous Improvement · Dhamrai, Dhaka
Jul 2026 – Present
  • One of 2 analysts in a 5-person CI team reporting to Sr. AGM; led all KPI, digitalization, and BA work across the department, managing 3 direct reports (Jr. Executives) & 3 Reporters
  • Continuing as Industrialization Leader for the Decathlon buyer project, sustaining OPEX Level-B performance while reporting to both Decathlon's OPEX/OWE standards and Snowtex senior management
  • Monitoring the 8 deployed operational systems to ensure sustained adoption and performance post go-live
Snowtex Group
Production Engineer — Continuous Improvement · Dhamrai, Dhaka
Jan 2024 – Jul 2026
  • Identified root cause of siloed operational data across factory functions, including 24 non-production departments; designed and deployed 8 end-to-end operational systems at Snowtex Group — spanning KPI analytics, cost performance, IoT monitoring, and digital traceability — eliminating manual reporting and reducing analysis time by 70%
  • Designated Industrialization Leader for the Decathlon buyer project — dual accountability to Decathlon's OPEX and OWE performance standards and Snowtex senior management; simultaneously serving as CI team member within Snowtex's internal structure. Contributed to Snowtex achieving OPEX Level-B (73%), the first Decathlon supplier in Bangladesh to reach this milestone. Recognised by name in Decathlon's Certificate of Appreciation for OWE & QCO performance contributions.
  • Delivered all KPI dashboards and BA outputs to Sr. AGM and full management team including Director level — personally presenting findings, recommendations, and roadmaps
  • Resolved stakeholder alignment conflicts across conflicting KPI definitions (Cost vs Production vs Quality); established single source of truth accepted across all departments
  • Built end-to-end Factory Cost-Performance Analytics system connecting operational KPIs to financial impact; gave management visibility into $60M+ yearly cost exposure
  • Designed cutting operations traceability system and got buy-in from initially resistant floor teams; deployed across 2 factories and 11 cutting floors
  • Designed and deployed IoT-enabled production monitoring system with a transparent incentive model operators accepted; scaled from 8 pilot lines to 172 lines factory-wide
🏆
Milestone · 2024–2025
First Decathlon supplier in Bangladesh to achieve OPEX Level-B (73%) — Certificate of Appreciation issued by name
Snowtex Group
Management Trainee – Process Engineering · Dhamrai, Dhaka
Oct 2023 – Jan 2024
  • Applied DMAIC methodology to diagnose cutting section performance stagnation at 42% OEE — used Value Stream Mapping and SIPOC analysis to map the current state across 21 machines, conducted root cause analysis with floor stakeholders, and identified a 40-step manual workflow with zero measurement infrastructure as the core problem
  • Designed solution architecture for 21-machine OEE measurement system; gained buy-in from cutting leaders through data-driven benchmarking
  • Built OEE KPI framework, measurement system, and digital dashboard; trained operators on data-backed accountability model
  • Result: OEE from 42% → 66% tracked over 12 months post-go-live; doubled machine utilization from 40% → 80%; reallocated 22 positions without output loss
Snowtex Group
Management Trainee – Industrial Engineering · Dhamrai, Dhaka
Jul 2023 – Oct 2023
  • Conducted operations analysis across woven production and supported process optimization initiatives
  • Analyzed production workflows and manpower allocation; contributed foundational work for incentive system design

Let's Connect

Open to Opportunities

Seeking roles in Business Analysis, CI Management, KPI Systems, Digital Transformation, and Operations Analytics — in manufacturing, operations, or supply chain. Based in Dhaka; open to remote and on-site.

tonmoy.niter@gmail.com Dhaka, Bangladesh Open to Full-Time & Contract GMT+6 · Bangladesh Standard Time Typically responds within 24 hours